Response chart-icon descriptions – Turning Technologies Response User Manual
Page 37
______________________________________________________________
Response User’s Guide
37 |
P a g e
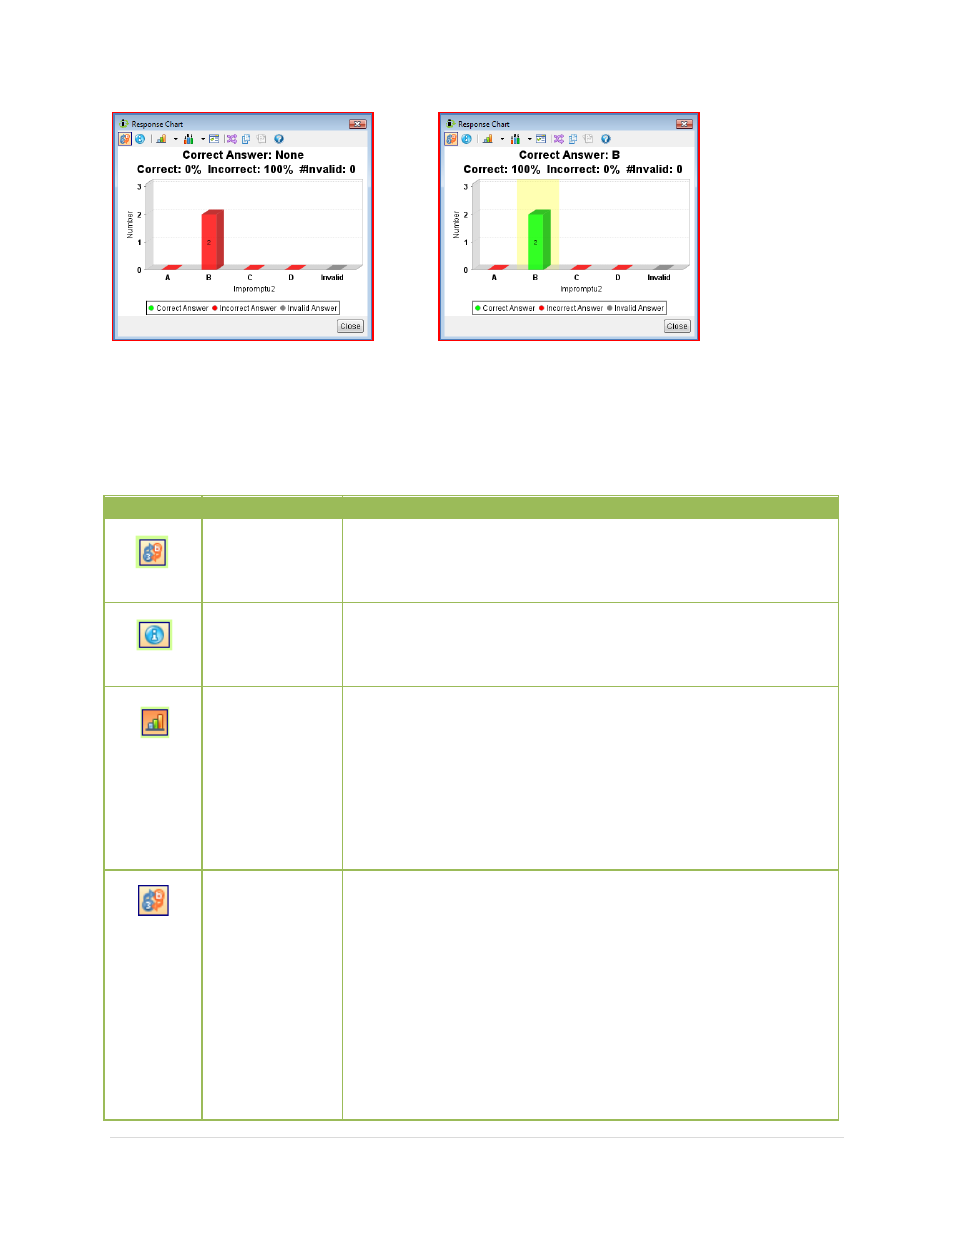
The correct answer in the Response Chart window changes from red to green.
Response Chart-Icon Descriptions
Tool Icon
Tool Name
Tool Description
Edit Question
Properties
Use to make changes to the question's properties after you
have reviewed response distribution. You can also access the
partial credit option from here.
Show Session
Data
Display the Session Data window where you will see a number
of different views of the response data.
Chart Type
• Vertical Chart: Display responses in a
vertical chart.
• Horizontal Chart: Display responses in a horizontal
chart.
• Pie Chart: Display responses in a pie chart.
• Histogram Chart Display responses in a histogram
format. This chart is only available for numeric question
types.
Data Sorting
• Bin Values: Display the frequency of each individual
correct response choice in a bin in the response chart.
This option is available only for multiple
correct/multiple choice question types.
• Top 5 Values: Display the top five most frequent
responses to the question. This option is available for
multiple correct/multiple choice, numeric and answer
series questions.
• Top 10 or 15 Values: Display the top 10 or 15 most
frequent responses to the question. This option is
available for multiple correct/multiple choice, numeric
and answer series questions.