Inserting an animated chart – Turning Technologies TurningPoint Cloud User Manual
Page 77
TurningPoint Cloud
77
To make a PowerPoint slide interactive, a TurningPoint Cloud chart
must be added to the slide. Assuming that the PowerPoint slide is
in Title and Content form, a chart can be added by following the
steps below.
1
Select the polling slide.
TIP
Select more than one slide by holding down
the Ctrl or Shift key on the keyboard.
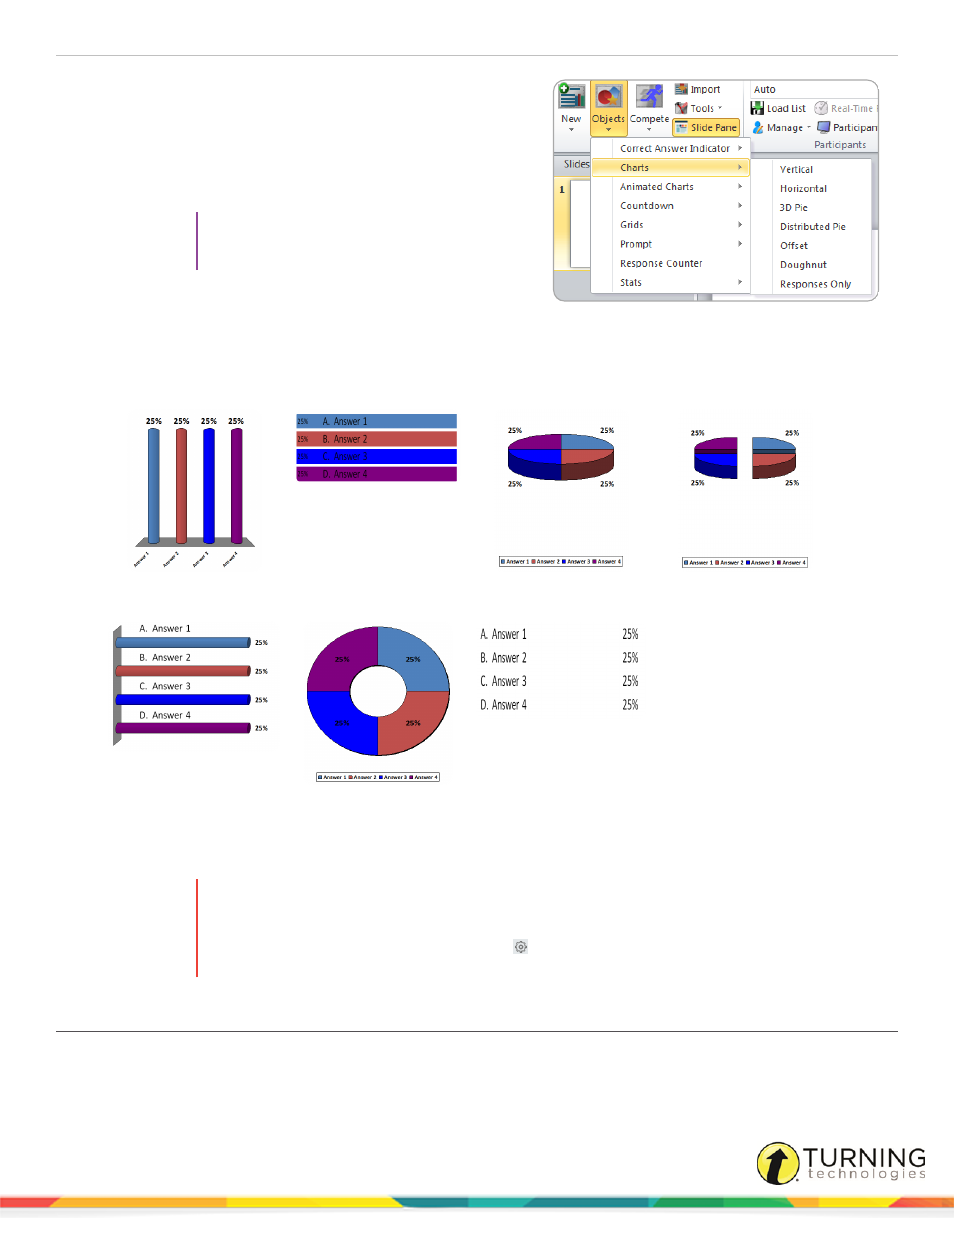
2
From the TurningPoint Cloud ribbon click the Objects icon,
mouse over Charts and select the desired chart.
There are seven chart types available.
Vertical
Horizontal
3D Pie
Distributed Pie
Offset
Doughnut
Responses Only
3
To change the current chart on the slide, select a different chart from the Objects menu.
4
To remove the chart, simply delete the object from the slide.
WARNING
Deleting a TurningPoint Cloud chart from a slide demotes the slide to non-interactive. To hide the
chart from the audience, simply uncheck the Show Results option in the Slide Preferences Pane
or to apply to all slides, click the Preferences
icon on the TurningPoint Cloud toolbar, select
PowerPoint, uncheck Show Results and click Apply All.
Inserting an Animated Chart
An animated chart is a flash object that appears over the Slide Show in full screen.
turningtechnologies.com/user-guides