C-set property dependencies, C-set regression coefficient, 28 c-set property dependencies – BUCHI NIRCal User Manual
Page 177: 29 c-set regression coefficient
Chemometrics
NIRCal 5.5 Manual, Version A
177
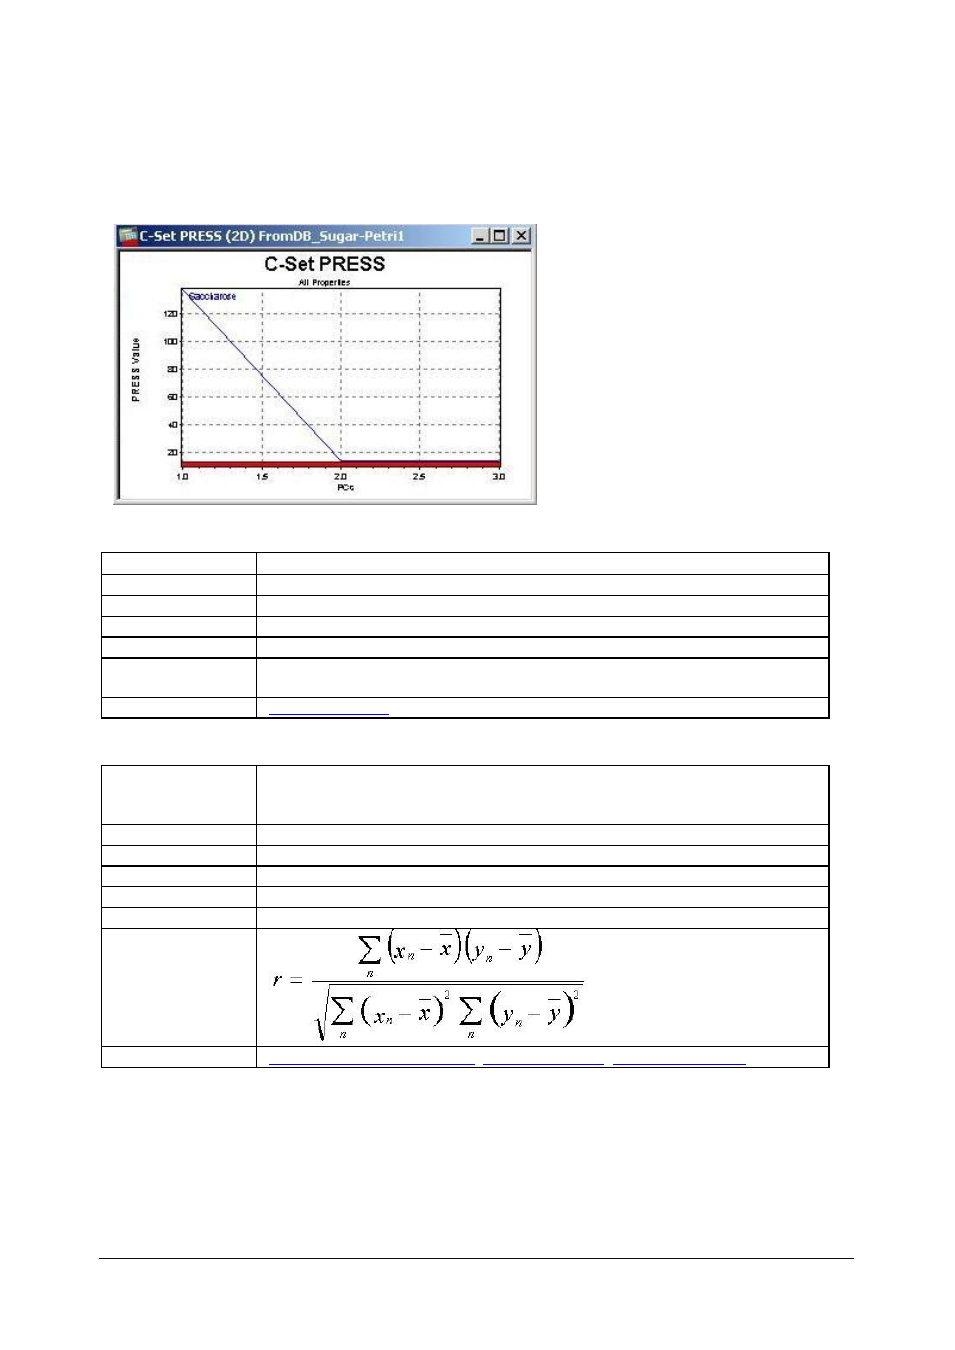
The optimum number of PC is always given by the smallest number of PC where the PRESS function
for the calibration and for the validation set is approximately equal and minimal.
If the error of the prediction diminishes only very slightly by the addition of another PC, it is not worth
while to add that PC. This is because higher PCs with little influence will often result in a poorer
reproducibility or stability of the calibration.
3.18.28
C-Set Property Dependencies
Description
Regression coefficient between all original C-Set spectra properties.
Use
Shows linear dependencies between different properties.
Method
MLR / PCR / PLS
Matrices ID
36
Tip
Use a table (grid) to check internal property dependencies
Details
Absolute regression coefficient near 1.0 shows that two properties are
linearly dependent. Only the property of C-Set Spectra take effect.
Related Topic
Original Property
3.18.29
C-Set Regression Coefficient
Description
Calibration Set Regression Coefficient of Original Property and Predicted
Property (also known as correlation coefficient or Pearson's correlation
coefficient)
Use
To compare with the V-Set regression Coefficient
Method
PCR / PLS
Matrices ID
18
Tip
Should be as close to 1 as possible.
Details
Visible on the calibration curve and in the calibration protocol.
Formula
Related Topic
V-Set Regression Coefficient
,
Original Property
,
Predicted Property
The regression coefficient "r" shows how well the predicted values match with the reference values
(original property values) on average.
The correlation is rated as acceptable when r > 0.9 is achieved (the error of the conventional reference
method goes into the NIR-calibration via the reference values).