Secondary pcs for quantitative calibration, 2 secondary pcs for quantitative calibration – BUCHI NIRCal User Manual
Page 127
Chemometrics
NIRCal 5.5 Manual, Version A
127
The Property Score Disorder values show how effective a particular PC separates different
properties (substances) from each other. By scanning the score values in one direction of a PC and
counting the changes between the membership of A or B, the disorder value is achieved. If a PC
completely separates all calibration properties, the smallest disorder value is: [the total number of
calibration properties-1].
PCs with small disorder values are possible calibration PCs.
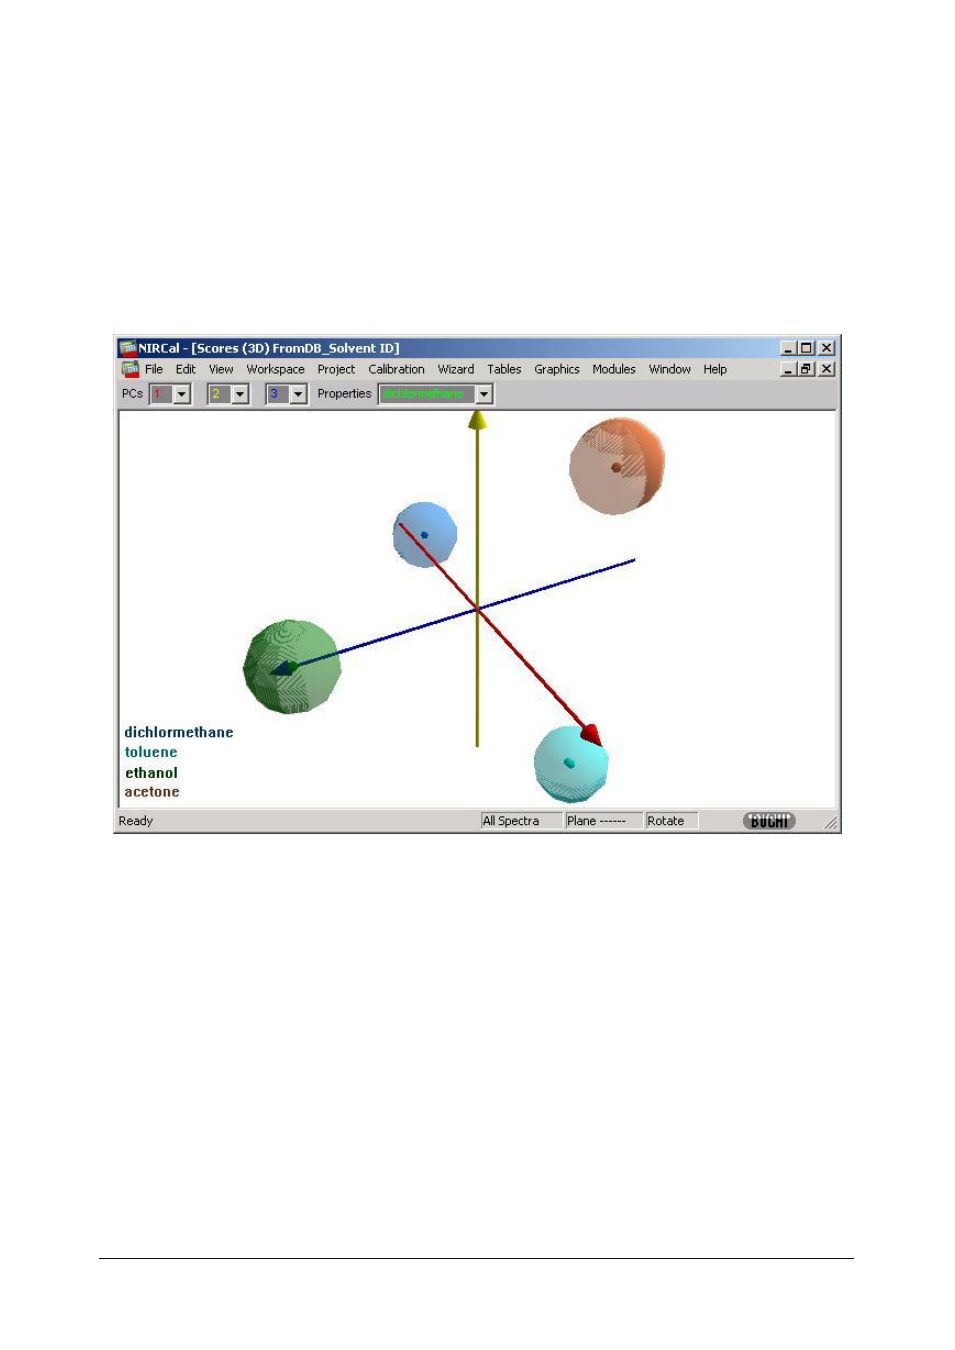
Summarising all the information available from the graphics for this example, the first 3
principal components (1-3) should be used as secondary PCs.
The separation with 3 selected calibration PCs is visible in a 3 D graphics.
The selected number of secondary PCs should be adjusted and the calibration recalculated.
NOTE
In case more than 3 secondary PCs are selected, there is no possibility to see the clusters with the
real radii in a 3D-Plot (more than 3D is not existent).
Try adjusting the xyz axis using the drop down list.
NOTE
To see the scattering in multi dimensions use Grafics / Scores / Multi 2D-Scatter.
3.8.2 Secondary PCs for quantitative Calibration
The secondary / calibration principal components are responsible for the parameter calculation and
for the quality of the calibration. Several statistical values can help this decision.
The most comprehensive results are in the Menubar: View / Secondary PCs Selection.