Left = ( o, T α 2 right = ( o, T α 2 – Casio SERIES FX-9860G User Manual
Page 347: 1 + n, Σleft = ( o
20070201
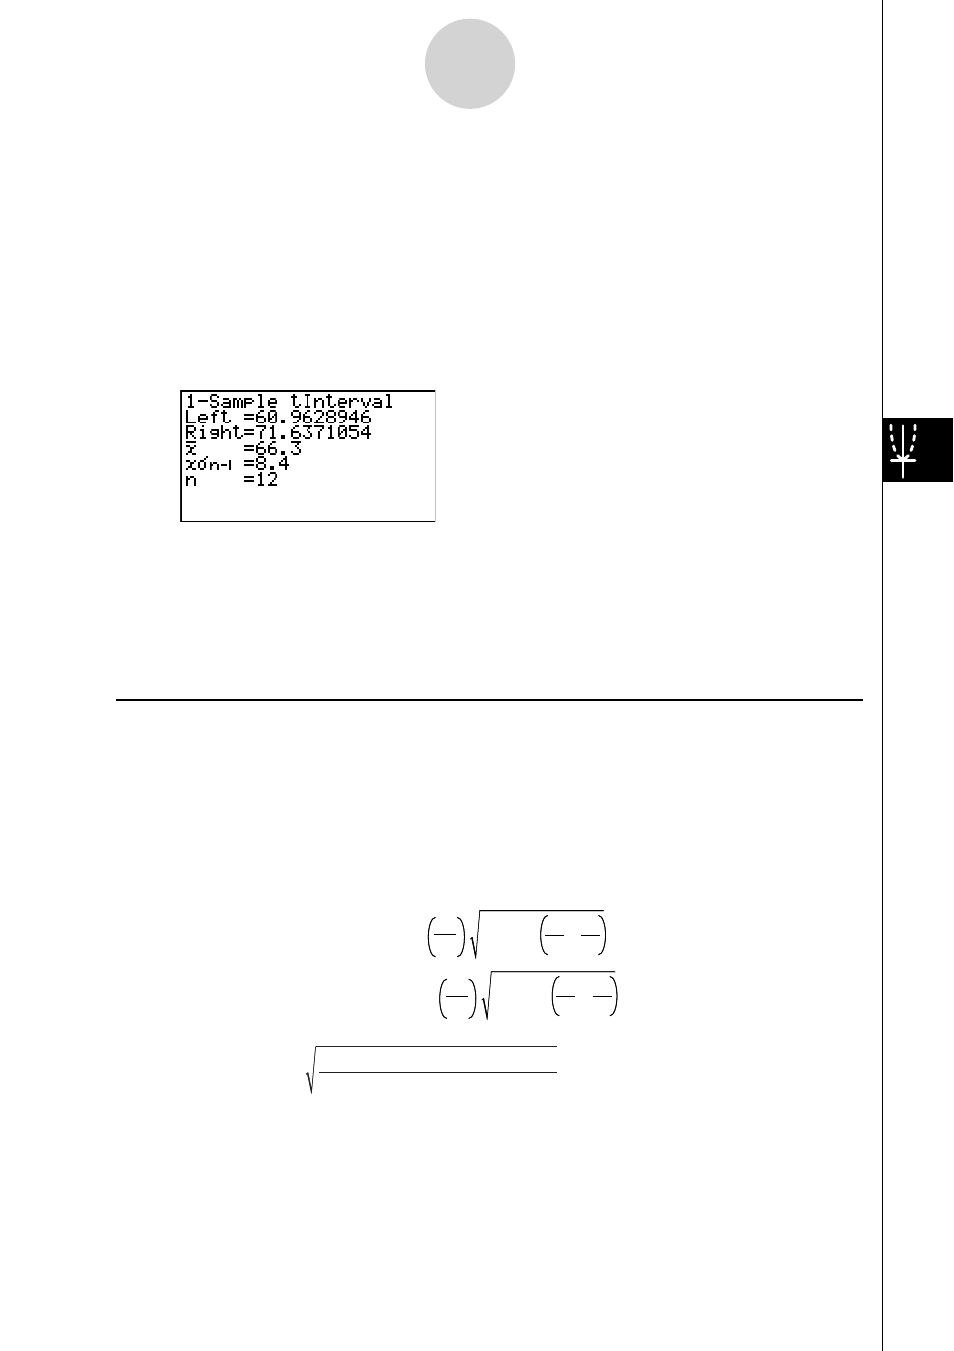
¯x
................................... mean of sample
x
σ
n
-1
............................. sample standard deviation (
x
σ
n
-1
> 0)
n
.................................. size of sample (positive integer)
After setting all the parameters, use
c to move the highlighting to “Execute” and then press
the function key shown below to perform the calculation.
•
1(CALC) ... Performs the calculation.
Calculation Result Output Example
Left ............................... confi dence interval lower limit (left edge)
Right ............................. confi dence interval upper limit (right edge)
o ................................... mean of sample
x
σ
n
-1
............................. sample standard deviation
n
.................................. size of sample
u 2-Sample
t
Interval
2-Sample
t
Interval calculates the confi dence interval for the difference between two
population means when both population standard deviations are unknown. The
t
interval is
applied to
t
distribution.
The following confi dence interval applies when pooling is in effect.
α is the level of
signifi cance. The value 100 (1 –
α
) % is the confi dence level.
Left = (
o
1
–
o
2
)– t
α
2
Right = (
o
1
–
o
2
)+ t
α
2
n
1
+n
2
–2
n
1
1 +
n
2
1
x
p
n
–1
2
σ
n
1
+n
2
–2
n
1
1 +
n
2
1
x
p
n
–1
2
σ
Left = (
o
1
–
o
2
)– t
α
2
Right = (
o
1
–
o
2
)+ t
α
2
n
1
+n
2
–2
n
1
1 +
n
2
1
x
p
n
–1
2
σ
n
1
+n
2
–2
n
1
1 +
n
2
1
x
p
n
–1
2
σ
x
p n
–1
=
σ
n
1
+ n
2
– 2
(n
1
–1)x
1 n–1
2
+(n
2
–1)x
2 n–1
2
σ
σ
x
p n
–1
=
σ
n
1
+ n
2
– 2
(n
1
–1)x
1 n–1
2
+(n
2
–1)x
2 n–1
2
σ
σ
6-6-9
Confi dence Interval