Casio SERIES FX-9860G User Manual
Page 213
20070201
5-6-4
Manual Graphing
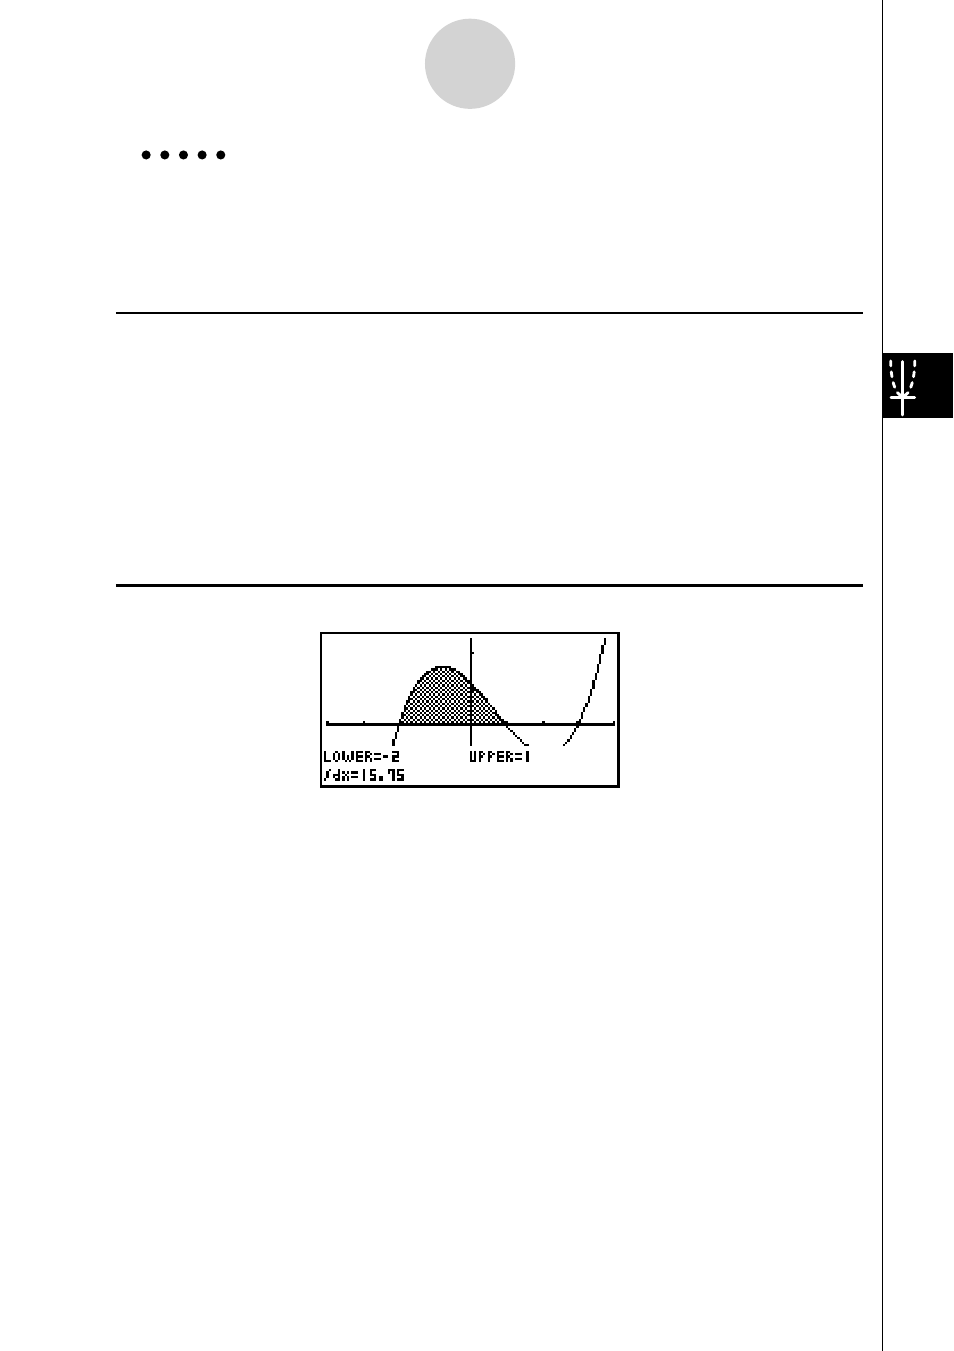
Example
Graph the integration
∫
1
–2
(
x
+ 2)(
x
– 1)(
x
– 3)
dx
.
Use the following V-Window settings.
Xmin = –4,
Xmax = 4,
Xscale = 1
Ymin = –8,
Ymax = 12,
Yscale = 5
Procedure
1 m RUN
•
MAT
2 !3(V-WIN) -ewewbwc
-iwbcwfwJ
3 !4(SKTCH)1(Cls)w
5(GRPH)5(G
•
∫ dx)
4 (v+c)(v-b)(v-d),
-c,bw
Result Screen
This manual is related to the following products: