Casio SERIES FX-9860G User Manual
Page 197
20070201
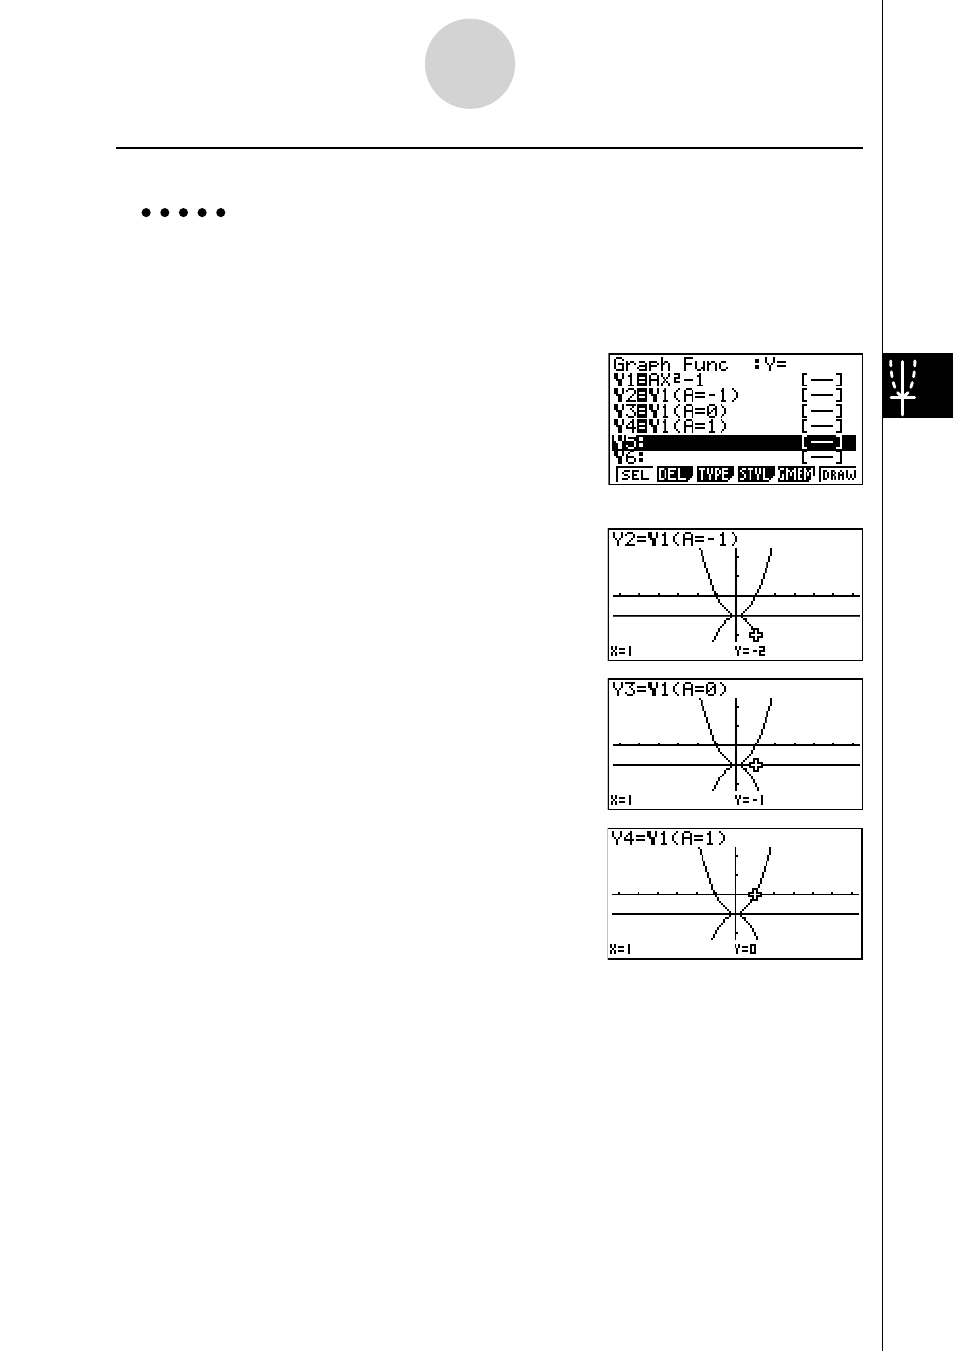
u To assign values to the coeffi cients and variables of a graph function
Example
To assign the values −1, 0, and 1 to variable A in Y = AX
2
−1, and draw a
graph for each value
3(TYPE)1(Y=)
av(A)vx-bw
J4(GRPH)1(Y)b(av(A)
!.(=)-b)w
J4(GRPH)1(Y)b(av(A)
!.(=)a)w
J4(GRPH)1(Y)b(av(A)
!.(=)b)w
ffff1(SEL)
6(DRAW)
The above three screens are produced using the Trace function.
See “5-11 Function Analysis” for more information.
5-3-4
Drawing a Graph
This manual is related to the following products: