Archived 4/2/10, 0 screens – ETS-Lindgren HI-4460 Graphical Readout (Archived) User Manual
Page 23
Screens
|
23
6.0 Screens
When the HI-4460 Graphical Readout is turned on for the first time, a series of
initial screens display, and then a user screen displays. After the first power on
sequence, the screen that was active when the unit was last turned off will
display.
Following is a description of the monitoring screens and logging screens.
For additional information, see Menu Tree on page 67.
Monitoring Screens
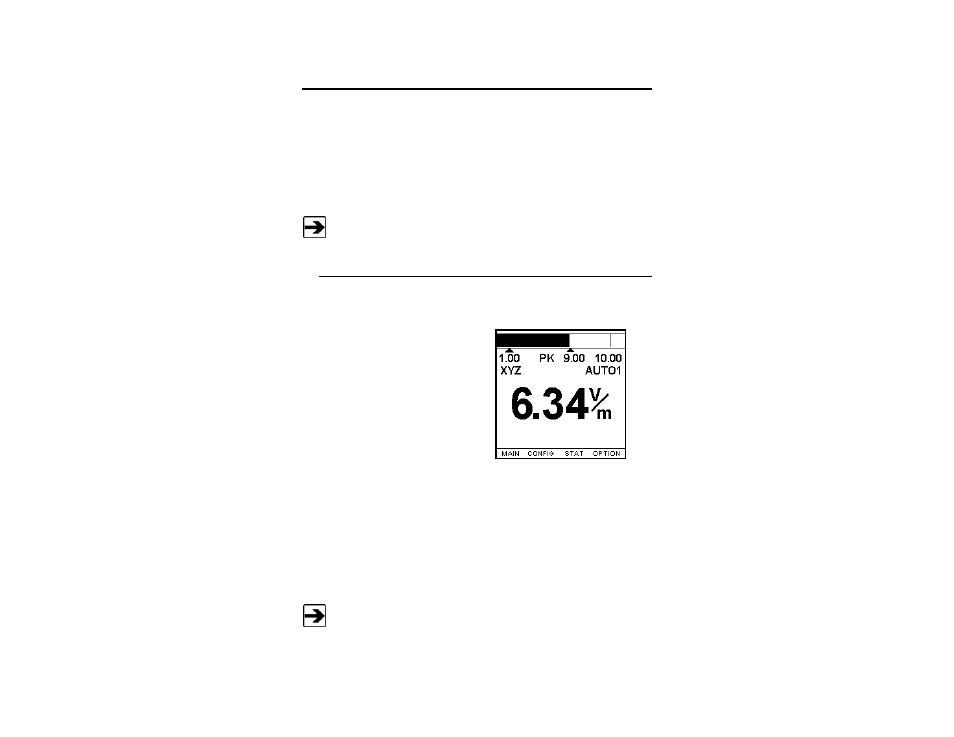
The first screen to display is the monitoring screen.
• Field strength displays at the top
of the screen as a bar graph.
Peak value
displays as a thin
vertical line next to the bar graph.
If the bar graph appears blank,
the value is less than the lower
range value. If the bar is
completely filled in, the value is
greater than the upper range
value.
Change to a different range to view the reading. Below the bar graph is a line of
text that shows selected range limits. The lower limit is on the left, the upper
limit is on the right, and the peak value is in the center.
Under the range limits is another line of text that shows the axes that are being
recorded, and the selected range. The axes are on the left side and the
selected range is on the right
An HI-60XX Series Field Probe has only one range. The scale
readings are for the displayed bar graph only. A scheduled log period
will display the word LOG in the center of this line. If the unit is logging
data, the word LOG will flash.
Archived 4/2/10