Metrohm 915 KF Ti-Touch User Manual
Page 215
■■■■■■■■■■■■■■■■■■■■■■
23 Results and more determination data
915 KF Ti-Touch
■■■■■■■■
201
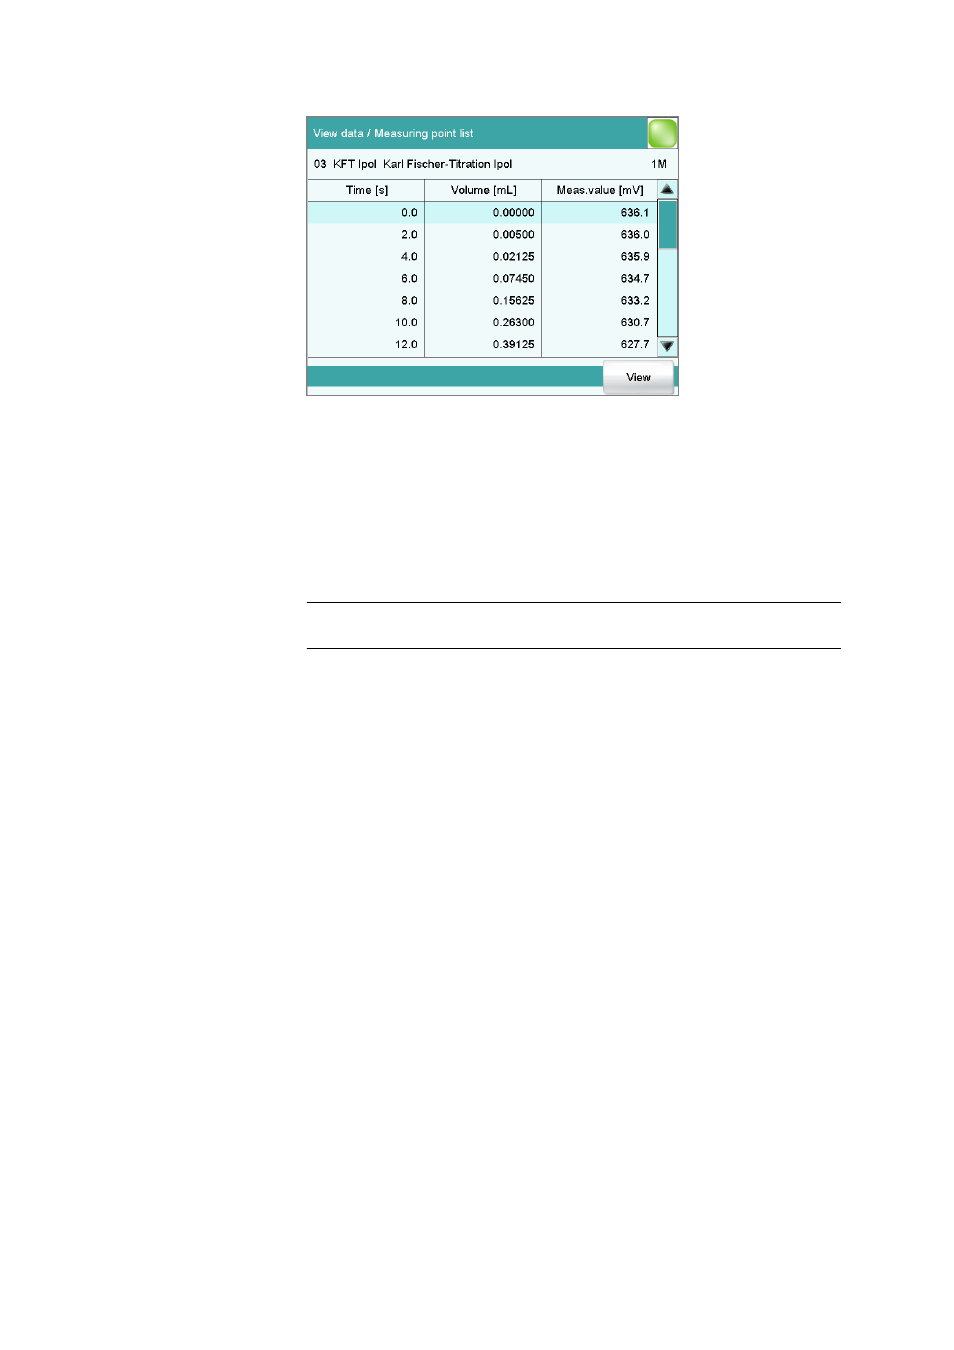
The individual measured values are listed in the View data / Measuring
point list dialog. You can configure which columns are displayed ([View]
button). These settings are saved separately for each mode (KFT, MEAS,
etc.).
Column 1 / Column 2 / Column 3
Quantity displayed in the columns 1, 2 and 3. Both the selection of the
quantities and the default setting depend on the mode.
Selection
Volume | Measured value | Time | Tempera-
ture | Volume drift | Signal drift | Index
Endpoint details
Results dialog: More data
▶ View data ▶ Endpoint details
Results dialog: Curve
▶ Display curve ▶ Endpoint details
Detailed information concerning each equivalence point or endpoint
determined is displayed in the View data / Endpoint details dialog.
The volume, the measured value, the time and the temperature are speci-
fied for each equivalence point or endpoint determined.
Titrant data
Results dialog: More data
▶ View data ▶ Titrant data
The titrant data which was current at the time the determination was per-
formed is displayed in the View data / Titrant data dialog.