CommScope Redwood version 3.1 User Manual
Page 6

Commissioning and Administration User Guide
5
Dashboard Tab
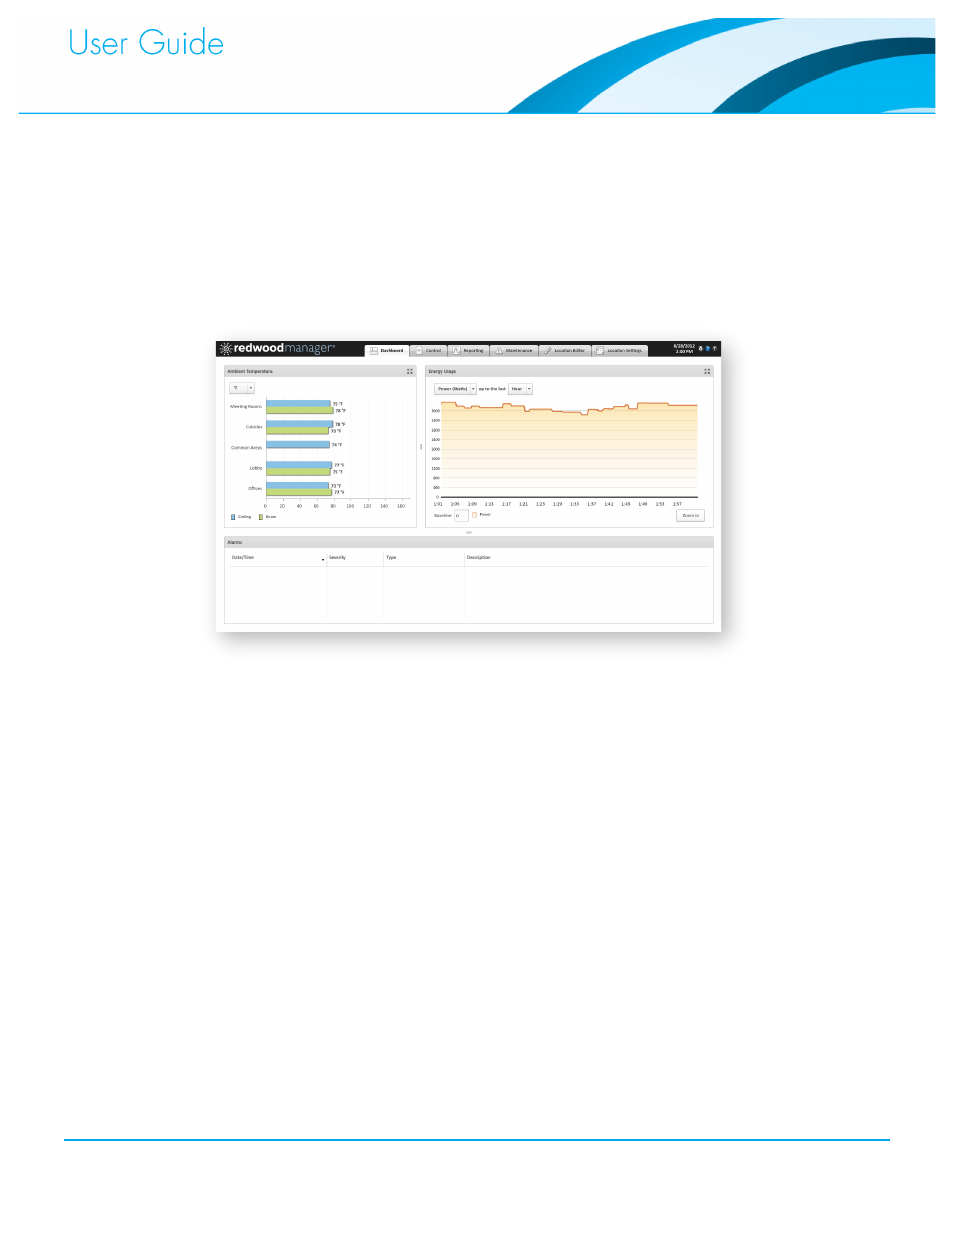
Within the Redwood Manager, the Dashboard tab provides a high-level view of the entire system.
Sensor measurements such as the total power consumed, the ambient temperature, ambient
light levels, and motion counts are aggregated over all Locations and plotted on a graph. A
baseline value can be overlaid on these plots to show a comparative picture. The “Zoom In”
button allows the selection of specific time windows. The baseline and zooming features are fully
described in the Reporting section of this guide.
The temperature and chart panes of the dashboard may be maximized to a full-screen view by
clicking the expand icon in the upper right corner of the pane, or by right-clicking in the Manager
and then selecting the “Go Full Screen” option.
Alarms are shown in the bottom pane of the dashboard. Occupancy alarms are triggered if
motion is detected in a Location where an alarm has been enabled. To enable an occupancy
alarm, see the Events and Policies section of this guide. Configuring power and temperature
alarms is covered in the Alerts and Alarms section of this guide.
Control Tab
The Control Tab allows users to manipulate the current light settings for each Location. For more
information on using these tools, please see the Commissioning and Administration Guide.
