Line output voltage level characteristics, Line output voltage level characteristics” on – Cirrus Logic CS42L52 User Manual
Page 19
DS680F2
19
CS42L52
3/1/13
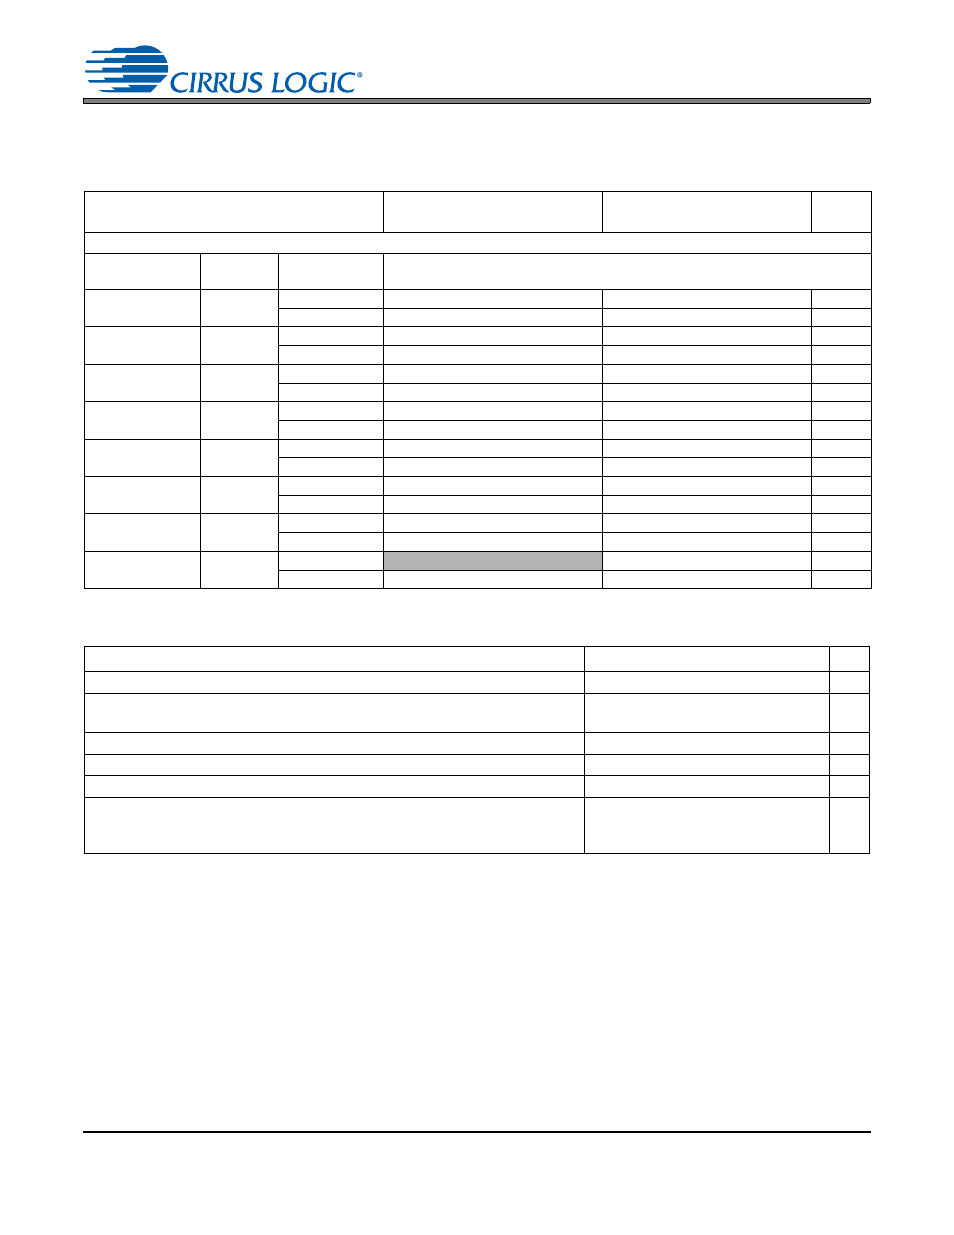
LINE OUTPUT VOLTAGE LEVEL CHARACTERISTICS
Test conditions (unless otherwise specified): Input test signal is a full-scale 997 Hz sine wave; measurement bandwidth is 20 Hz
to 20 kHz; Sample Frequency = 48 kHz; Test load R
L
= 10 k
C
L
= 10 pF (see
“Required Initialization Settings” on
written on power up.
COMBINED DAC INTERPOLATION AND ONCHIP ANALOG FILTER RESPONSE
12. Response is clock dependent and scales with Fs. Note that the response plots (
and
) have been normalized to Fs and can be de-normalized by multiplying the X-axis scale by Fs.
13. Measurement Bandwidth is from Stopband to 3 Fs.
Parameters VA
=
2.5V
Min Typ Max
VA = 1.8V
Min Typ Max
Unit
AOUTx Voltage Into R
L
= 10 k
HP_GAIN[2:0] Analog
Gain (G)
VHP
000
0.3959
1.8 V
-
1.34
-
-
0.97
-
V
pp
2.5 V
-
1.34
-
-
0.97
-
V
pp
001
0.4571
1.8 V
-
1.55
-
-
1.12
-
V
pp
2.5 V
-
1.55
-
-
1.12
-
V
pp
010
0.5111
1.8 V
-
1.73
-
-
1.25
-
V
pp
2.5 V
-
1.73
-
-
1.25
-
V
pp
011 (default)
0.6047
1.8 V
-
2.05
-
1.41
1.48
1.55
V
pp
2.5 V
1.95
2.05
2.15
-
1.48
-
V
pp
100
0.7099
1.8 V
-
2.41
-
-
1.73
-
V
pp
2.5 V
-
2.41
-
-
1.73
-
V
pp
101
0.8399
1.8 V
-
2.85
-
2.05
V
pp
2.5 V
-
2.85
-
-
2.05
-
V
pp
110
1.0000
1.8 V
-
3.39
-
-
2.44
-
V
pp
2.5 V
-
3.39
-
-
2.44
-
V
pp
111
1.1430
1.8 V
-
2.79
-
V
pp
2.5 V
-
3.88
-
-
2.79
-
V
pp
Min
Typ
Max
Unit
Frequency Response 10 Hz to 20 kHz
-0.01
-
+0.08
dB
Passband
to -0.05 dB corner
to -3 dB corner
0
0
-
-
0.4780
0.4996
Fs
Fs
StopBand
0.5465
-
-
Fs
StopBand Attenuation
50
-
-
dB
Group Delay
-
9/Fs
-
s
De-emphasis Error
Fs = 32 kHz
Fs = 44.1 kHz
Fs = 48 kHz
-
-
-
-
-
-
+1.5/+0
+0.05/-0.25
-0.2/-0.4
dB
dB
dB