HP SAN User Manual
Page 48
4.
Open one of the following files:
• Index.html — if you have selected to receive the processed report in HTML format in the
Data Collection window. You can use any web browser to view the HTML report.
NOTE:
Some versions of the Internet Explorer does not allow ActiveX contents, and a message is
displayed on these browsers informing that the ActiveX contents have been blocked. In order
to view the complete SAN Visibility report with the topology diagrams, select the
Allow Blocked Contents option on the browser.
•
format in the Data Collection window.
The SAN Visibility report contains the following information:
•
General information:
• Customer Contact Details – Customer information entered in the Customer Details window, an
overview of the contents, and the layout of the report package.
• License Information – SAN Visibility License agreement
•
SAN Information:
• High Level Fabric Summary – Contains a summary of all the fabrics in the SAN, including
component information, such as switches, arrays, hosts, and HBAs.
•
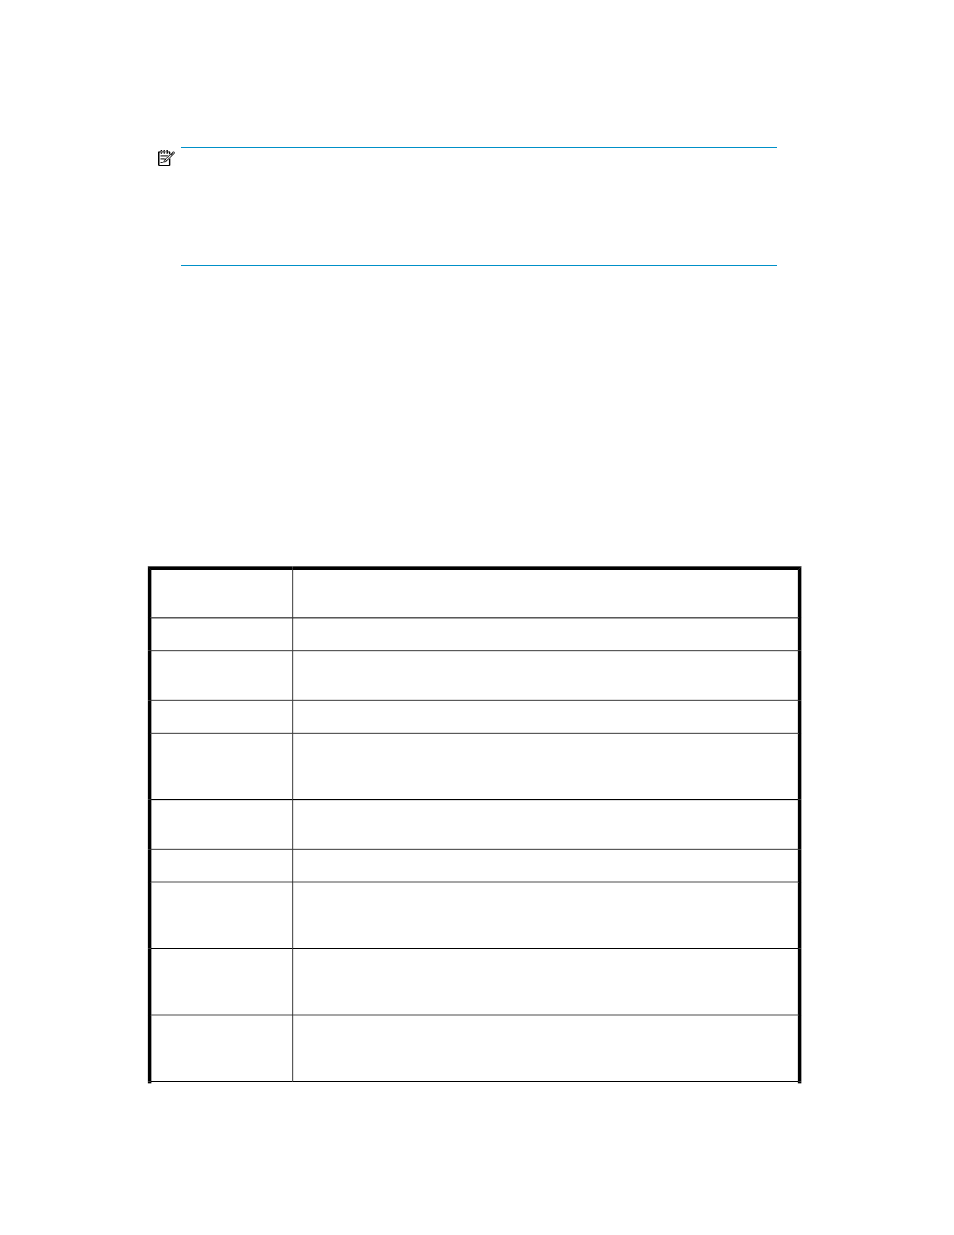
Fabric Information (for each fabric in the SAN):
Displays switches, arrays, HBAs, and their connectivity in HTML format
HTML Topology Dia-
gram
Displays switches, arrays, HBAs, and their connectivity in Microsoft Visio
Visio Topology
Displays the list of switches. Select a switch from the list to view the detailed switch
report
Switch Details
Displays SAN device nodes and connections found in the fabric
Node List
Displays the list of storage arrays and tape devices present in the SAN. Select an
array from the list to view the detailed array report. Select a tape device from the
list to view the detailed tape device report.
Storage Devices
Displays the list of HBAs. Select an HBA from the list to view the detailed HBA re-
port.
HBA Details
Displays the list of hosts. Select an host from the list to view the detailed host report.
Hosts
Provides I/O performance statistics on a per port basis for each switch. Performance
charts are generated only when you have selected the Capture Performance Data
checkbox in the Data Collector screen.
Performance Charts
Summarizes the zones identified and displayed in the fabric layout. If there are
multiple zones in a fabric, each zone and its member devices are displayed in a
separate table.
Zone Report
For a Cisco switch, this report summarizes the VSANs identified and displayed in
the fabric layout. If there are multiple VSANs in a fabric, each VSAN and its
member devices are displayed in a separate table.
VSAN Details
Using SAN Visibility
48