Thermo Fisher Scientific CyberComm 6000 for CyberScan Series 6000 User Manual
Page 54
Instruction Manual
CyberComm 6000
48
Figure 39 : View Graph
4. Click Zoom In or Zoom Out button to zoom in or out the graph.
5. Click on the graph and drag it horizontally or vertically to pan the graph. Panning
is useful if you wish to see a graph which has been plotted for a long period of
time or covering wide variations of data values.
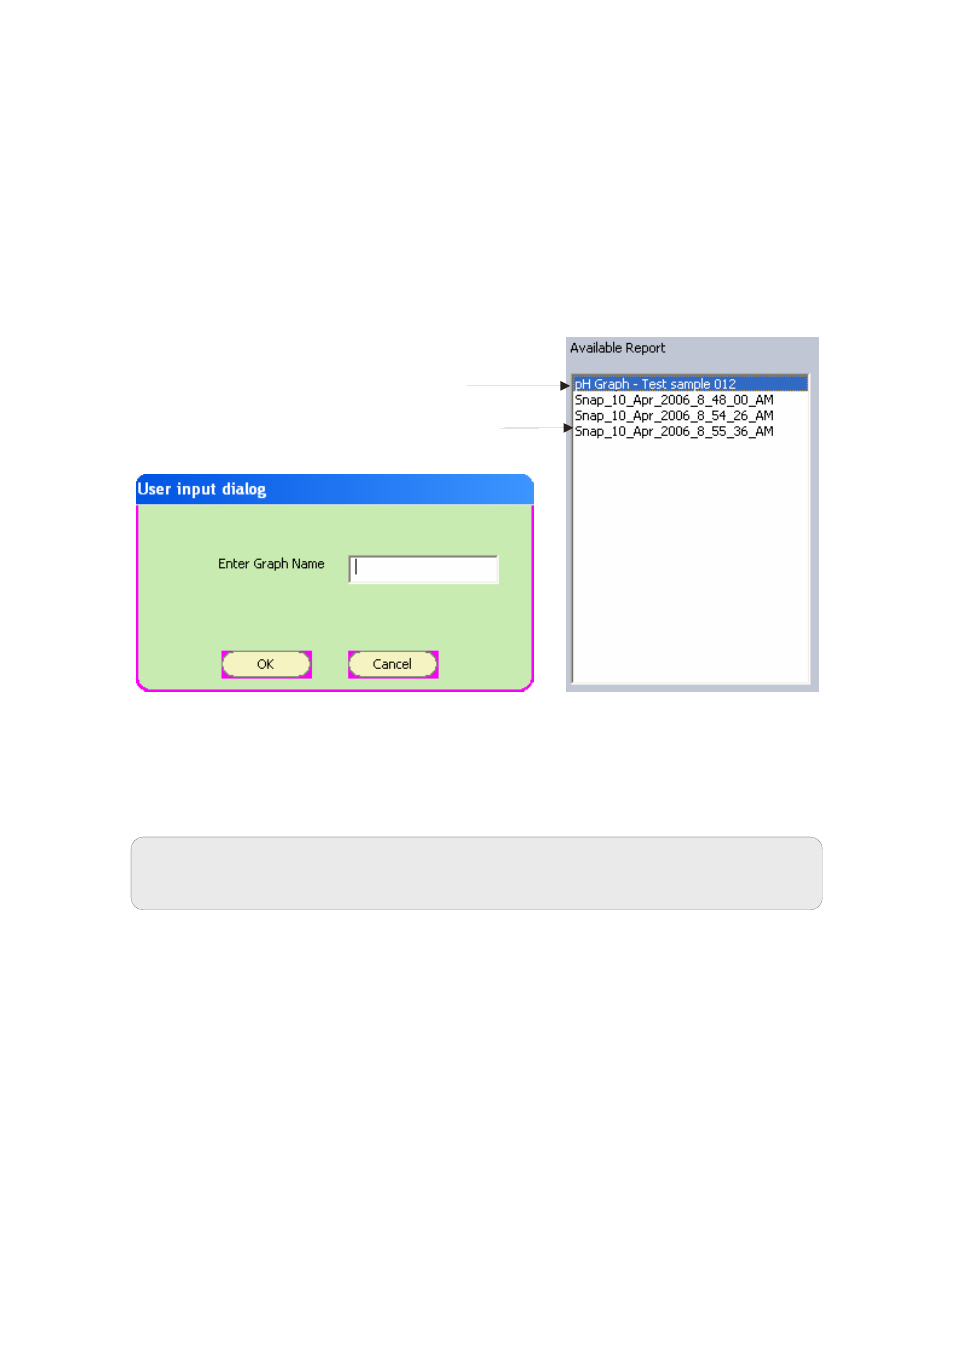
6. Click Save button, if you wish to save the graph. A dialog appears. (Figure 40)
7. Enter a suitable name and click OK. The graph is saved. The new graph is added
to Available Reports list. You may view graphs in this list by double-clicking on a
name.
Figure 40 : Saving a graph
8. The ‘snap shot’ graphs saved from the measurement screen (using Snap Graph
button) are listed in the Available Reports list. You can double-click on a snap
graph to view.
Note: Refer ‘Taking a Snap Shot of Graph’ in page 43 for more details
on snap graphs.
Saved Graphs
Saved Snap Graphs
- PCTestr 35 (2 pages)
- pHScan BNC (3 pages)
- pHScan 3/3+ (5 pages)
- pHTestr 1 (3 pages)
- pHTestr 10/20/30/10 BNC/Spear (2 pages)
- ORPTestr 10/10 BNC (2 pages)
- EC/TDS/SaltTestr 11 (4 pages)
- EC/TDS/SaltTestr (2 pages)
- ECScan High/Low & TDScan High/Low (9 pages)
- SaltTestr (2 pages)
- EcoTestr pH 2 (2 pages)
- EcoTestr pH 1 (2 pages)
- EcoTestr EC High (2 pages)
- EcoTestr EC Low (2 pages)
- EcoTestr TDS High (2 pages)
- EcoTestr TDS Low (2 pages)
- EcoTestr Salt (2 pages)
- Eutech pH 5/6 Plus & Ion 6 Plus (New version R1.1, SN >797406) (23 pages)
- Eutech pH 5/6 Plus & Ion 6 Plus (Old version EP6, SN <797406, discontinued) (23 pages)
- Eutech COND/TDS/Salt 6 Plus (40 pages)
- Eutech DO 6 Plus (48 pages)
- EcoScan pH/Ion 5 & 6 (27 pages)
- EcoScan CON 6 & TDS 6 (56 pages)
- EcoScan CON 5 & TDS 5 (18 pages)
- EcoScan Salt 6 (40 pages)
- EcoScan DO 6 (80 pages)
- CyberScan pH 10/pH 100 (67 pages)
- CyberScan pH 11/pH 110 (76 pages)
- CyberScan CON 10/CON 100/CON 200 (62 pages)
- CyberScan CON 11/CON 110 (80 pages)
- CyberScan DO 110 (60 pages)
- CyberScan PCD 650 (127 pages)
- CyberScan CON 400/410 (For units manufactured before March 2010, discontinued) (60 pages)
- CyberScan CON 400 (For units manufactured from March 2010 onwards) (60 pages)
- CyberScan pH 300/310 (52 pages)
- CyberScan DO 300 (60 pages)
- CyberScan PC 300 (72 pages)
- CyberScan PD 300 (76 pages)
- CyberScan PC 10 (31 pages)
- C401 Colorimeter (64 pages)
- TN100 Turbidimeter (31 pages)
- RS232C Interface Adapter (9 pages)
- Thermo Scientific Temp 360 (44 pages)
- Thermo Scientific Temp 340 (40 pages)
- Thermo Scientific Temp 300 (32 pages)