3 view graph – Thermo Fisher Scientific CyberComm 6000 for CyberScan Series 6000 User Manual
Page 53
Instruction Manual
CyberComm 6000
47
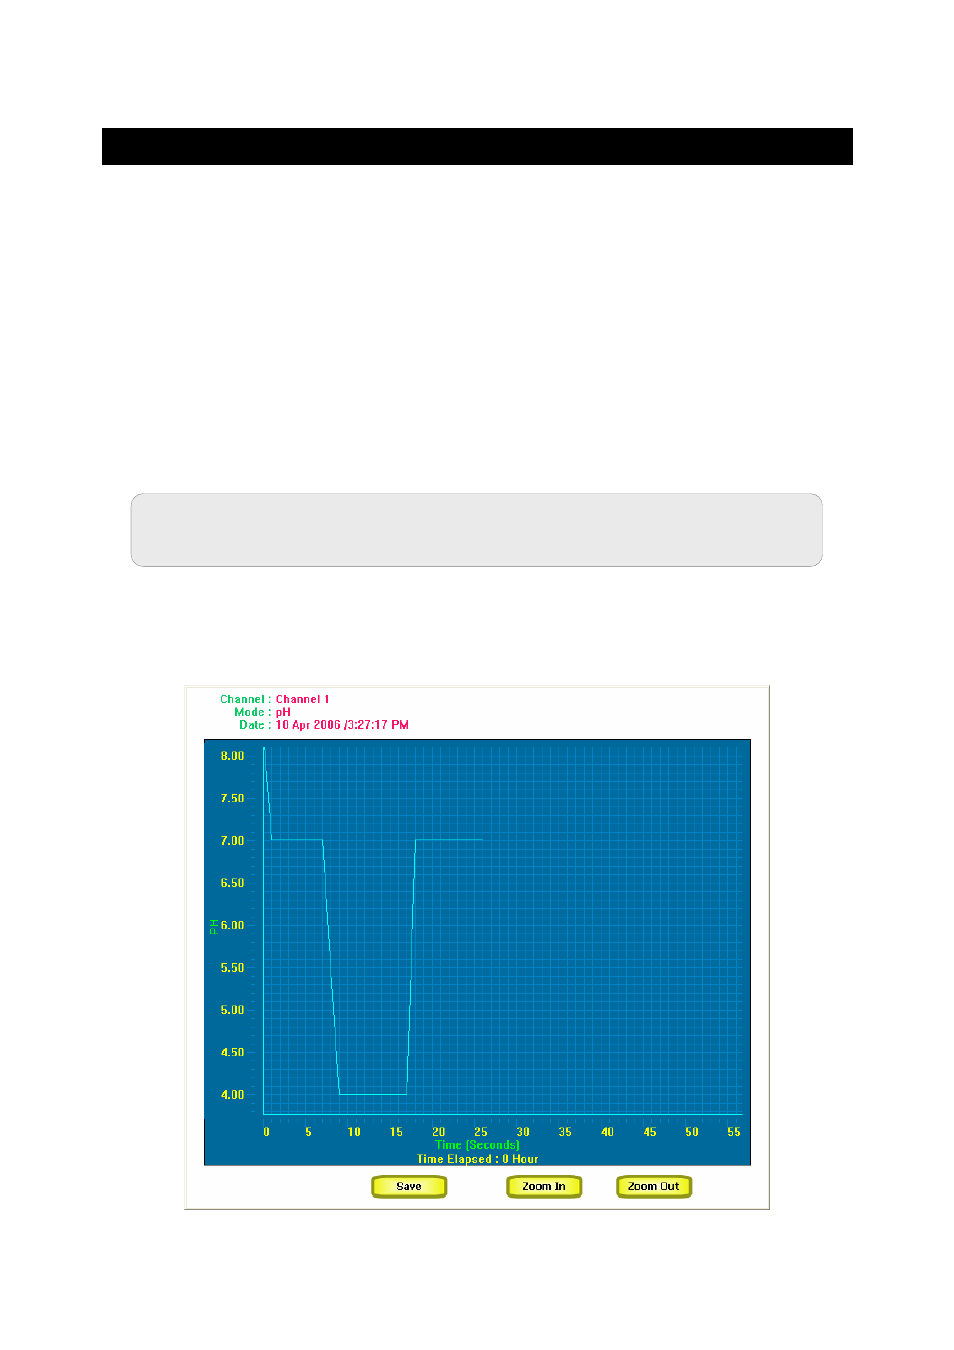
5.3 View Graph
The View Graph is an extension to the ‘Show graph’ feature available in CyberScan
meter for single channel measurement mode. Use this to view graphs (snap graphs)
which have been previously captured at measurement screen or view current
measurement graphs of a selected channel.
To view graph:
1. To see current measurement graph:
Make sure you are in single-channel mode. (Multi-channel check box
should be unchecked)
From
Measure tab, select the channel and its parameter you wish to view.
Click
Show Graph button in the measurement screen. The graph starts
plotting data.
2. Click on Reports tab.
3. Click View Graph button. The plotted graph is shown. (Figure 39)
Note: In order to view the graph of the currently selected channel, you
have to click Show Graph button in the measurement screen.
- PCTestr 35 (2 pages)
- pHScan BNC (3 pages)
- pHScan 3/3+ (5 pages)
- pHTestr 1 (3 pages)
- pHTestr 10/20/30/10 BNC/Spear (2 pages)
- ORPTestr 10/10 BNC (2 pages)
- EC/TDS/SaltTestr 11 (4 pages)
- EC/TDS/SaltTestr (2 pages)
- ECScan High/Low & TDScan High/Low (9 pages)
- SaltTestr (2 pages)
- EcoTestr pH 2 (2 pages)
- EcoTestr pH 1 (2 pages)
- EcoTestr EC High (2 pages)
- EcoTestr EC Low (2 pages)
- EcoTestr TDS High (2 pages)
- EcoTestr TDS Low (2 pages)
- EcoTestr Salt (2 pages)
- Eutech pH 5/6 Plus & Ion 6 Plus (New version R1.1, SN >797406) (23 pages)
- Eutech pH 5/6 Plus & Ion 6 Plus (Old version EP6, SN <797406, discontinued) (23 pages)
- Eutech COND/TDS/Salt 6 Plus (40 pages)
- Eutech DO 6 Plus (48 pages)
- EcoScan pH/Ion 5 & 6 (27 pages)
- EcoScan CON 6 & TDS 6 (56 pages)
- EcoScan CON 5 & TDS 5 (18 pages)
- EcoScan Salt 6 (40 pages)
- EcoScan DO 6 (80 pages)
- CyberScan pH 10/pH 100 (67 pages)
- CyberScan pH 11/pH 110 (76 pages)
- CyberScan CON 10/CON 100/CON 200 (62 pages)
- CyberScan CON 11/CON 110 (80 pages)
- CyberScan DO 110 (60 pages)
- CyberScan PCD 650 (127 pages)
- CyberScan CON 400/410 (For units manufactured before March 2010, discontinued) (60 pages)
- CyberScan CON 400 (For units manufactured from March 2010 onwards) (60 pages)
- CyberScan pH 300/310 (52 pages)
- CyberScan DO 300 (60 pages)
- CyberScan PC 300 (72 pages)
- CyberScan PD 300 (76 pages)
- CyberScan PC 10 (31 pages)
- C401 Colorimeter (64 pages)
- TN100 Turbidimeter (31 pages)
- RS232C Interface Adapter (9 pages)
- Thermo Scientific Temp 360 (44 pages)
- Thermo Scientific Temp 340 (40 pages)
- Thermo Scientific Temp 300 (32 pages)