2 graphic sheet – Thermo Fisher Scientific CyberComm 6000 for CyberScan Series 6000 User Manual
Page 51
Instruction Manual
CyberComm 6000
45
5.2 Graphic Sheet
The Graphic Sheet allows you to create a customized graphical chart (Pie chart or
Histogram) for a set of available data in CyberComm. The chart is created for a
selected parameter (mode) of a channel of your choice. Data selection criteria allow
you to select data by date, range or sequence. You can create as many charts as
you wish, save them and print.
To add a new Graphic Sheet:
1. Go to Reports control tab.
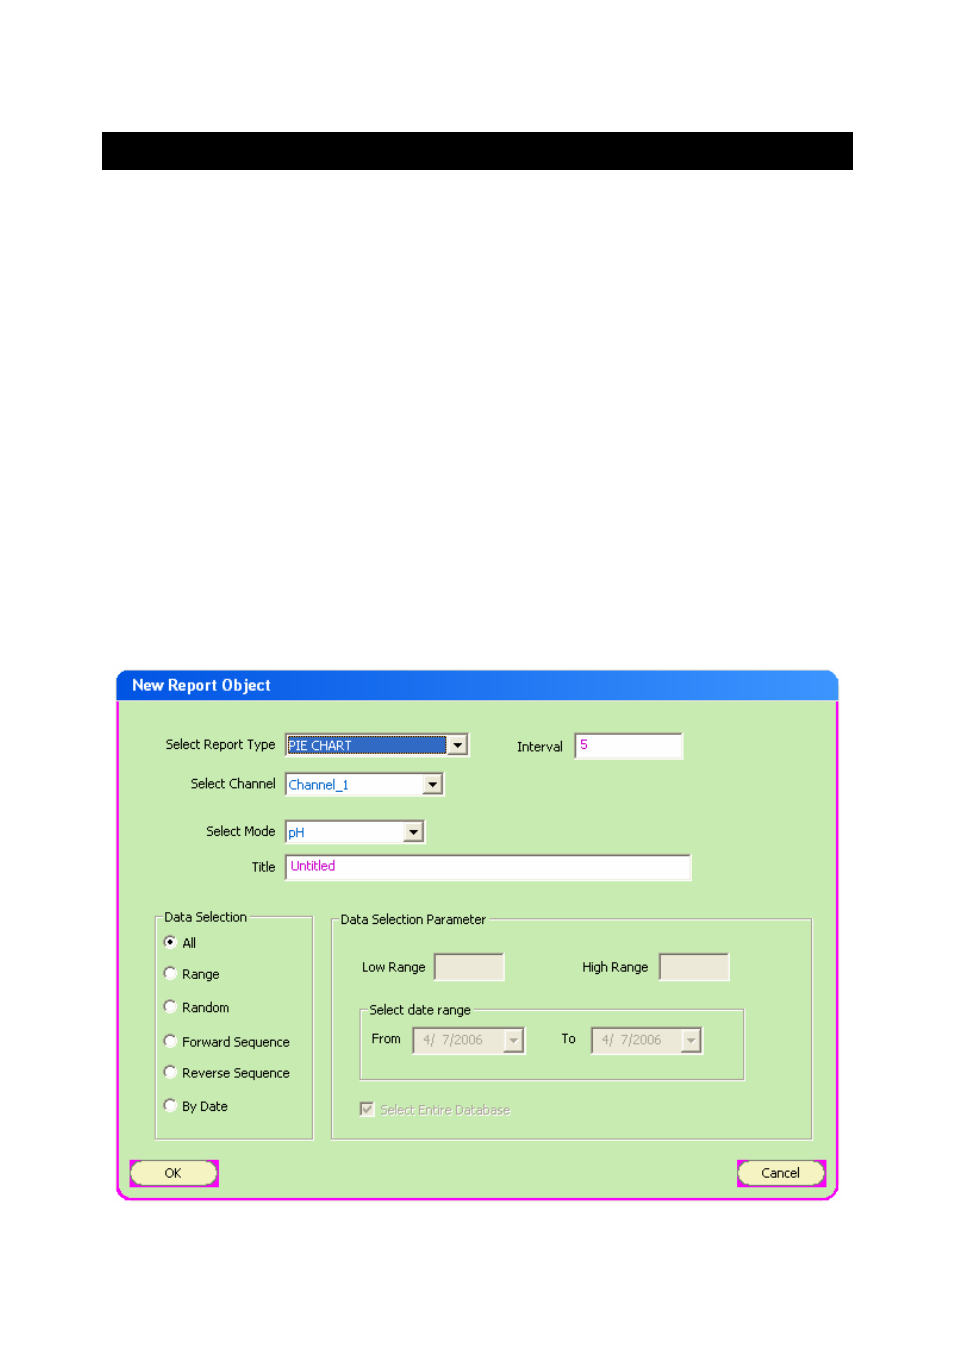
2. Click Add Report. The New Report Object dialog appears. (Figure 37)
3. Select the report type (Pie chart or Histogram) from the Select Report Type drop-
down box.
4. From Select Channel drop-down box, select the channel number for which you
wish to create graphical report.
5. From Select Mode drop-down box, select the parameter (mode) for which you
wish to create graphical report.
6. In Interval field, specify data interval for the report.
7. In Title field, specify a title for the graphical report. This will be printed at the top of
the report. (Check any limitation on number of characters?)
Figure 37 : Adding a new Graphic sheet