HT instruments SOLAR300N User Manual
Page 114
SOLAR300 - SOLAR300N
EN - 112
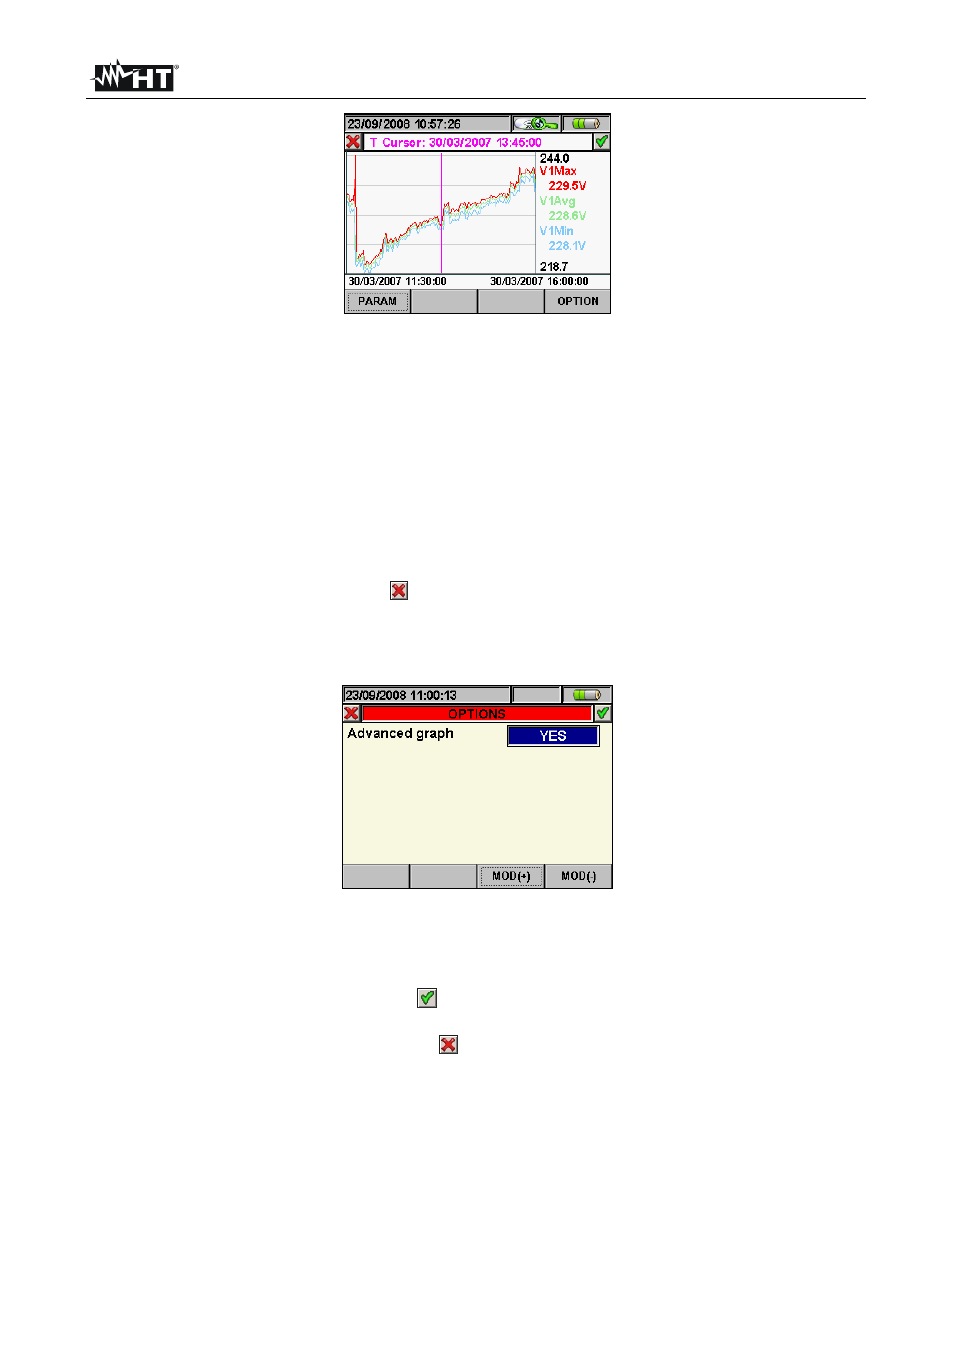
Fig. 179: Recording graph
The following keys are active on this page:
The F1 key (or the PARAM item on the display), to access the page of selectable
parameters (Fig. 178)
Press
the
F2 key to see the characteristic parameters of the photovoltaic system relevant to
the point considered. Information is similar to that described in § 5.7.2.2 , but referred to the
instant selected on the graph (i.e. the performance of the system in the instant considered
and not necessarily the maximum performance previously described). This function is NOT
available for recordings carried out with MPP300.
The
F4 key (or the OPTIONS item on the display), to access the page for the activation of
the “Advanced Graph” (Fig. 180)
The
ESC key (or the smart icon on the display), to exit the function and go back to the
“Recording analysis” page (Fig. 172)
Press the F4 key (or the OPTIONS item on the display) to access the page for the activation of
the Advanced Graph (Fig. 159):
Fig. 180: Options (Advanced Graph)
The following keys are active on this page:
The
F3 and F4 keys (or the MOD(+) and MOD(-) items on the display) enable the user
to choose YES or NO for the advanced graph
The
ENTER key (or the smart icon
on the display) confirms the selection previously
made
Press
the
ESC key (or the smart icon on the display) to exit the function and go back
to the “Selecting a parameter” page(Fig. 177)
Example of advanced graph
Let us take a recording of 2000 pixels into consideration. The instrument has a display with
a useful resolution of about 200 pixels; therefore, it is not able to distinctly display all the
pixels in our recording. How does it operate then? The first pixel in the graph will be the
analysis of the first 10 points in the recording, i.e. the highest of the 10 values will be
selected as maximum value, the lowest of the values will be selected as minimum value
and the average value will be the first of the series of samples, and so on, to create all
other pixels in the graph.