HT instruments SOLAR300N User Manual
Page 100
SOLAR300 - SOLAR300N
EN - 98
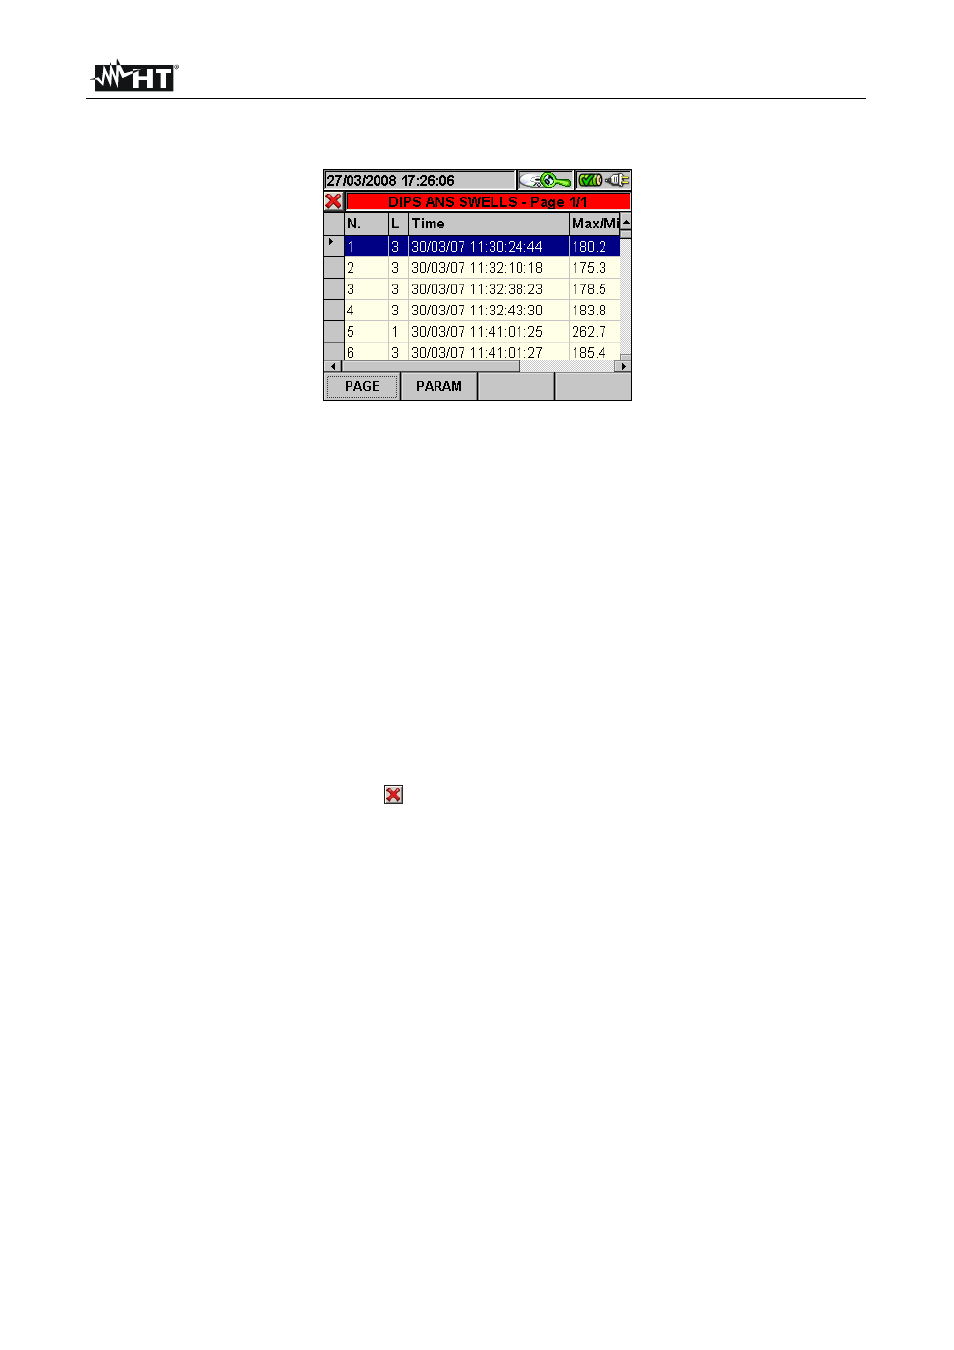
5.7.1.3. Dips ans swells
This page shows a table containing all voltage anomalies occurred during recording.
Fig. 160: Dips ans swells
Column description:
N.:
progressive number of the anomaly.
L.:
phase in which the anomaly occurred.
Date/Time:
date/time at which the anomaly occurred.
Max/Min:
maximum/minimum value of the anomaly.
Duration:
duration of the anomaly.
Type:
type of anomaly (voltage reduction or overvoltage).
The following keys are active on this page:
The up and down arrow keys move the cursor along the voltage anomalies.
The up and down arrow keys move the column display to the right or to the left.
The
F1 key (or the PAG item on the display) advances to the following page of voltage
anomalies (to be selected with the F3 or F4 key or through the items MOD (+) or MOD
(-) on the display).
The F2 key (or the PARAM item on the display) accesses the page showing the
settings for voltage anomalies (Fig. 161).
The ESC key (or smart icon ) to exit the function and go back to the “Recording
analysis” page (Fig. 154).