HT instruments SOLAR300N User Manual
Page 113
SOLAR300 - SOLAR300N
EN - 111
5.7.2.4. Recording graph
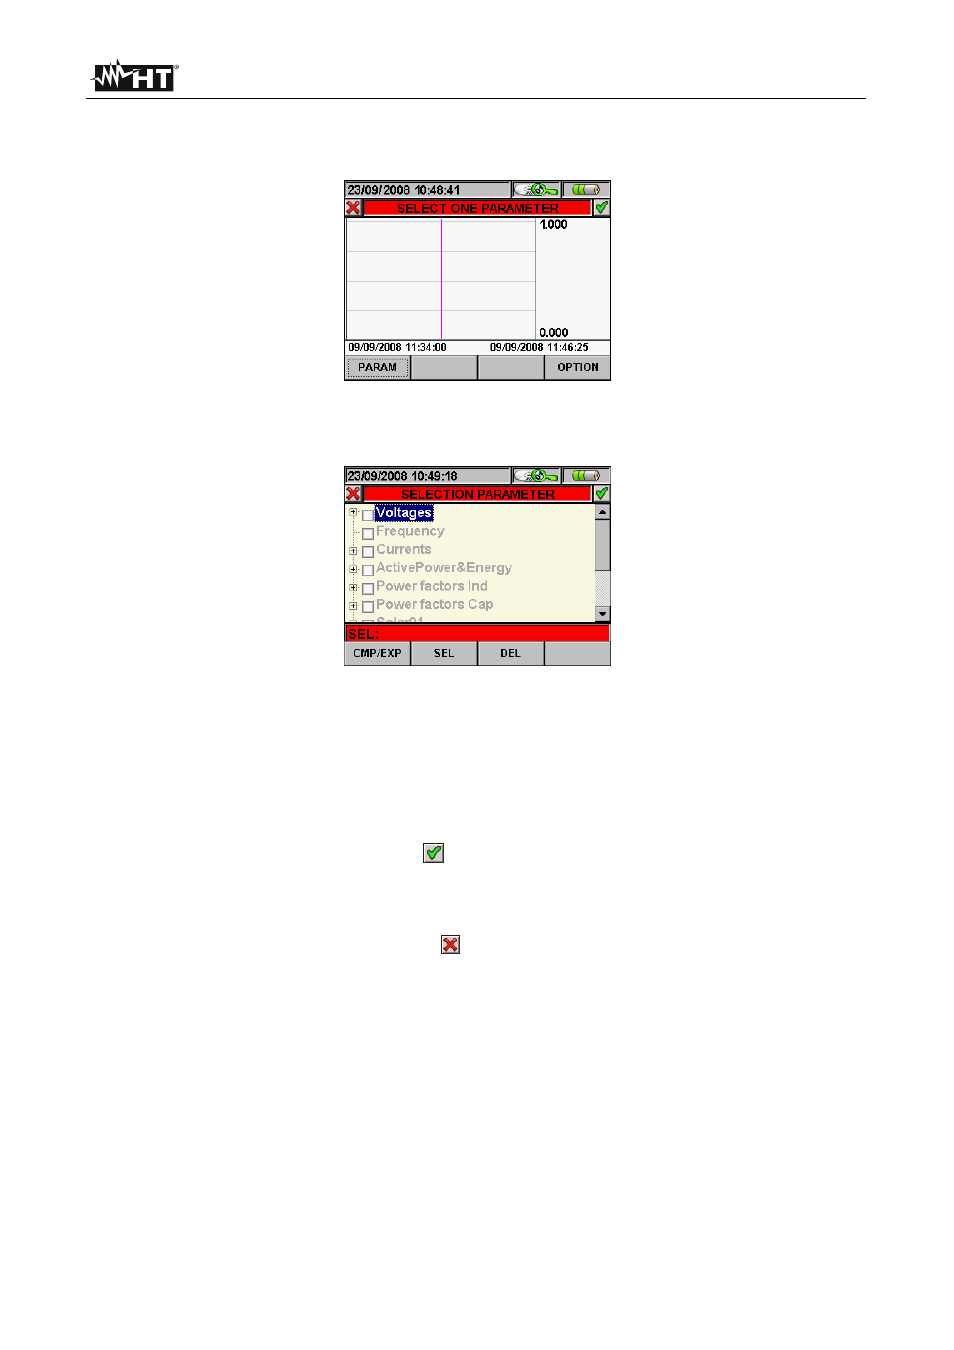
By selecting the recording graph option, the following page is accessed, which enables the
user to display the recording trend (ONLY ONE parameter at a time).
Fig. 177: Selecting a parameter
1. Press the F1 key (or the PARAM item on the display) to access the page of selectable
parameters (Fig. 178).
Fig. 178: Parameter selection
The following keys are active on this page:
The up and down arrow keys move the cursor along the quantity tree
The
F1 key (or the CMP/EXP item on the display) compresses and expands the tree of
the quantity highlighted by the cursor
The F2 key (or the SEL item on the display) selects or deselects the parameter
highlighted by the cursor
The
ENTER key (or the smart icon
on the display) confirms the selection previously
performed and display the graph of the selected parameter (Fig. 179)
The CANC key deselects the parameter previously selected, independently from the
position of the cursor
Press
the
ESC key (or the smart icon
on the display) to exit the function and go back
to the “Selecting a parameter” page (Fig. 177)
This page shows graph, maximum RMS value, average RMS value and minimum RMS
value of the selected parameter and the position of the cursor.