Lincoln Electric IM8001 PRODUCTION MONITORING 2.2 User Manual
Page 87
Chapter 5. Using Production Monitoring™
Production Tab
5.14
Production Monitoring™ User Manual
IM8001
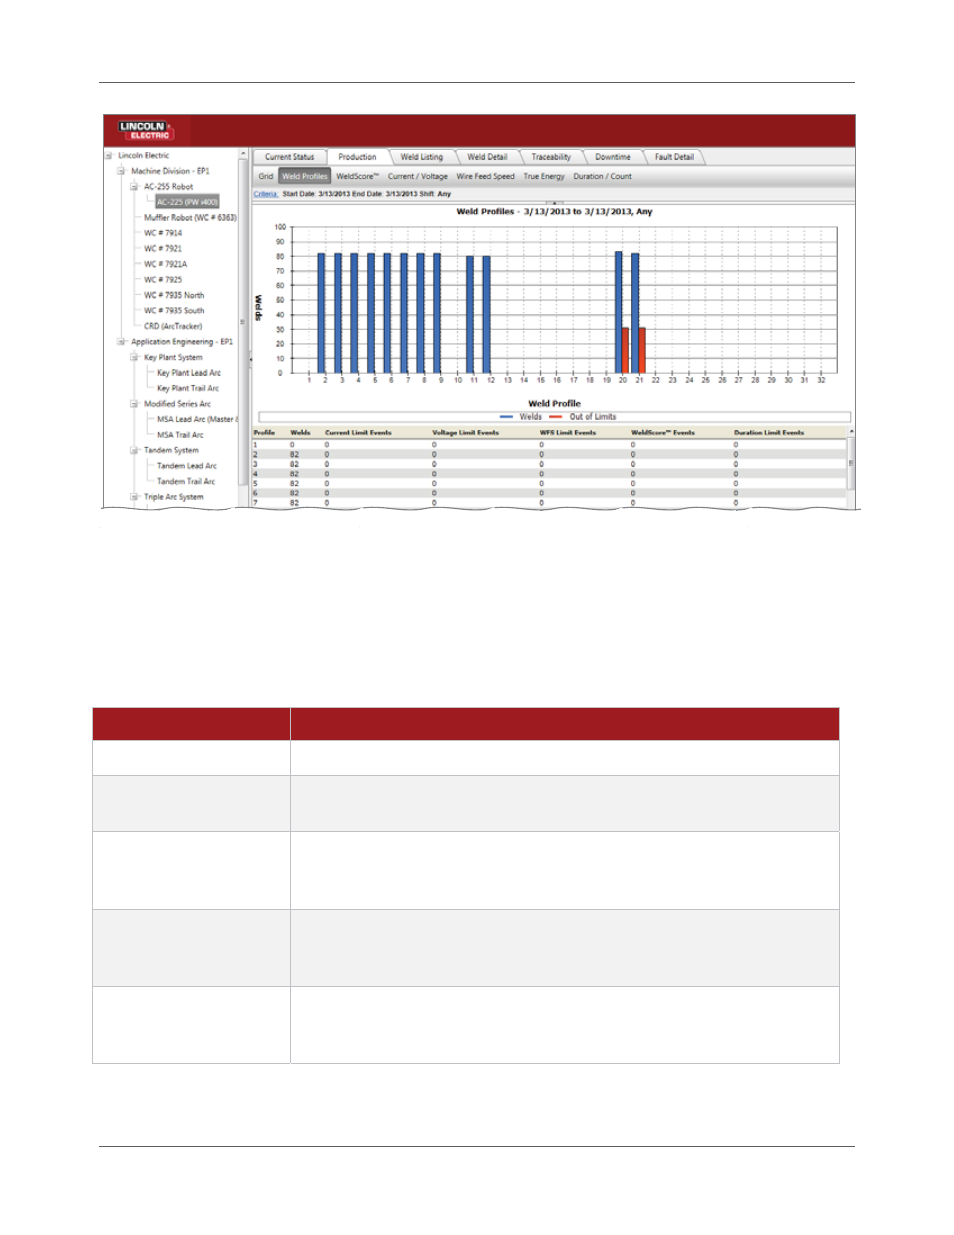
Figure 5.14 Production Report: Weld Profiles
The top half of the report is a graph that displays the number of welds that were made using each Weld
Profile and the number of those welds that were out of limit for that profile.
The bottom half of the report is a list that summarizes the weld data for each Weld Profile and further
breaks down the welds that were out of limit into what caused it to be out of limit. Table 5.6 explains the
columns on the list in more detail.
Table 5.6
Columns on the Weld Profiles Report
Column
Description
Profile
This column simply lists the Weld Profile number.
Welds
The Welds column displays the total number of welds performed using this
Weld Profile during the date range and shift selected for the report.
Current Limit Events
The Current Limit Events column displays the number of welds that were
outside of the minimum and maximum acceptable arc current values set in
the profile.
Voltage Limit Events
The Voltage Limit Events column displays the number of welds that were
outside of the minimum and maximum acceptable arc voltage values set in
the profile.
WFS Limit Events
The WFS Limit Events column displays the number of welds that were
outside of the minimum and maximum acceptable wire feed speed values
set in the profile.