Downtime tab – Lincoln Electric IM8001 PRODUCTION MONITORING 2.2 User Manual
Page 112
Downtime Tab
Chapter 5. Using Production Monitoring™
IM8001
Production Monitoring™ User Manual
5.39
The Downtime tab summarizes any faults that occur in the system and how much “downtime” has
accumulated due to each type of fault and displays this data in either a graph or chart format. This is a
great tool if you need to figure out why your welders aren’t welding.
For example, if a Thermostat fault occurred at 11:01:05 AM and cleared at 11:06:30 AM, this counts as a
single fault with a duration of five (5) minutes and 25 seconds.
NOTE |
Only the primary event that caused a Welding Power
Source to fault will be displayed and counted. While the
primary event is active, no other events that happen will be
displayed or counted.
Downtime Criteria
The criteria available for the Downtime reports allow you to customize the reports to meet your needs.
Table 5.22 explains the fields in more detail. The criteria for both reports are the same, with the exception
of one additional field that is available for the Chart report (i.e., Top Quantity). For more in-depth
information on report criteria in general, please see page 5.4.
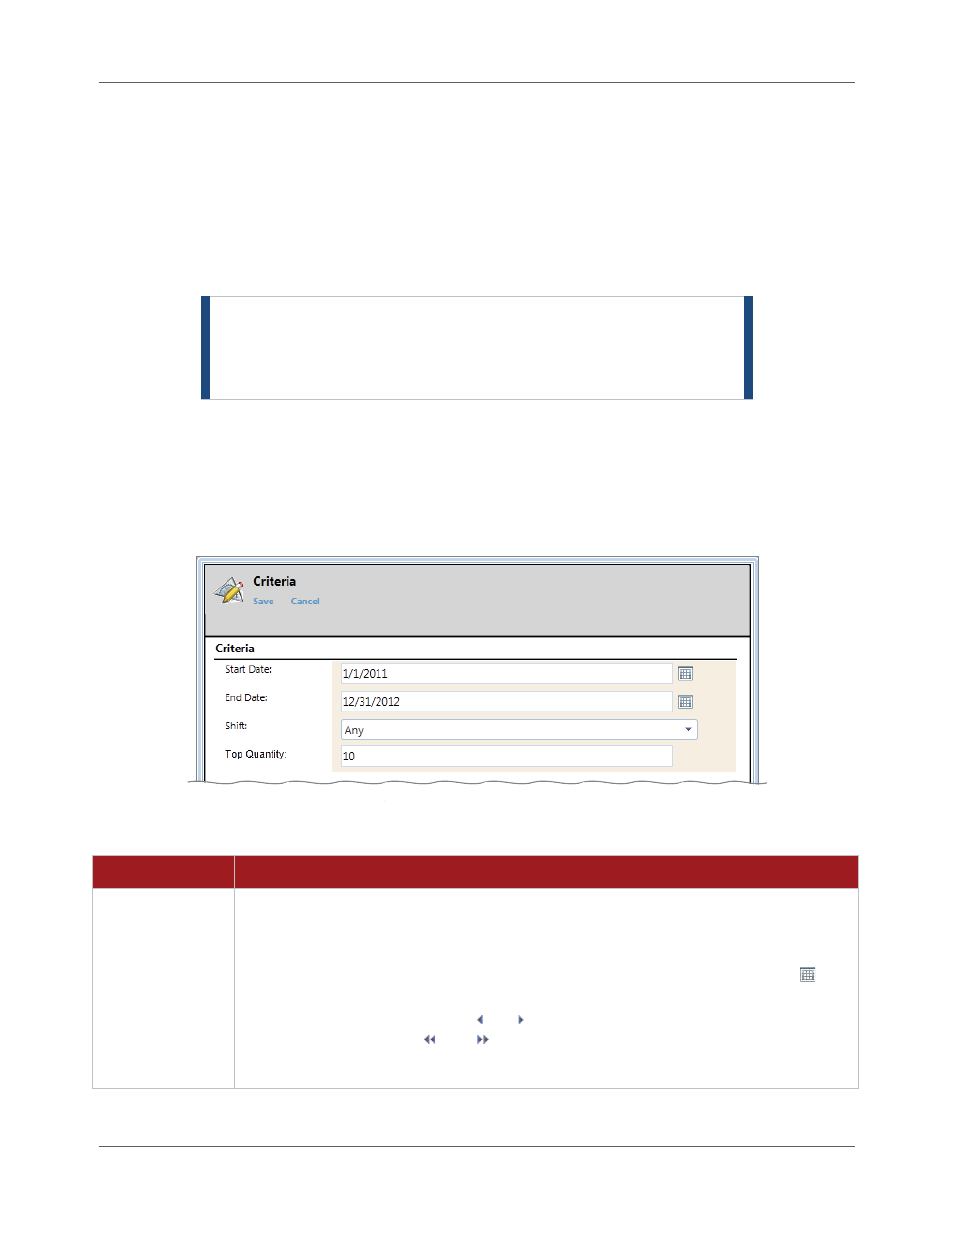
Figure 5.31 Downtime Report Criteria
Table 5.22
Criteria Available on the Downtime Report
Field
Description
Start Date and
End Date
Select a date range in which the fault(s) occurred to display the data you want to
review. Fault(s) that occurred within this date range (that also meet all other criteria
you select) appear in the resulting report.
TIP |
You can type the date into the field, or you can click the calendar icon ( )
next to the field to display an interactive calendar where you can click on the date
you want. Use the arrow icons ( and ) to navigate to previous or future months.
The double arrow icons ( and ) move forward and backward by three-month
intervals.