Lincoln Electric IM8001 PRODUCTION MONITORING 2.2 User Manual
Page 85
Chapter 5. Using Production Monitoring™
Production Tab
5.12
Production Monitoring™ User Manual
IM8001
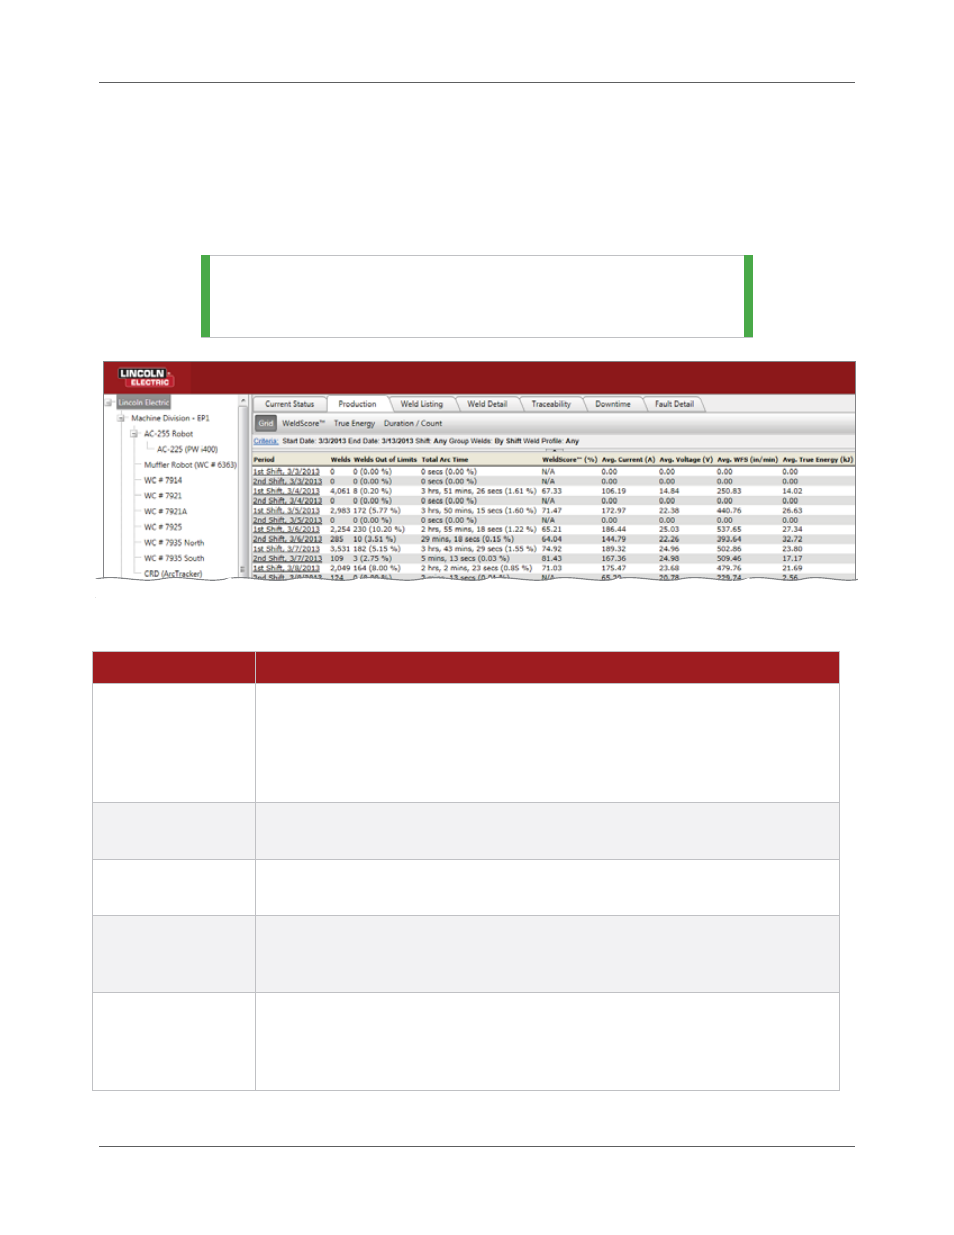
Grid Report
The Grid report provides you with a list that summarizes the weld data from the production floor based on
the criteria you have selected for the report (Figure 5.13). You can see a Grid report for either a single
Welding Power Source or a Group of power sources. Table 5.5 explains the columns of the report in more
detail.
TIP |
Use
the
Criteria link to customize the data to meet your
needs. See Table 5.4 on page 5.11 for details on the criteria
available.
Figure 5.13 Production Report: Grid
Table 5.5
Columns on the Production Grid Report
Column
Description
Period
The Period column reflects the choice made in the Group Welds drop-down on
the Criteria window, as well as the Start Date/End Date range and Shift selected.
To generate a report for a specific Period in the report, click the link. The system
automatically generates a Grid report on the Weld Listing tab based on just the
period you clicked.
Welds
The Welds column reflects the total number of welds performed during the time
period represented by the Period column.
Welds Out of Limit
This column lists the number of welds listed in the Welds column that were out
of limit and what percentage of total welds that number represents.
Total Arc Time
The Total Arc Time is the total number of hours that the Welding Power Source
or Group of power sources you selected in the Asset Tree were spent in the
Welding state during the time period listed in the Period column.
WeldScore™
The WeldScore™ column represents the average score of the welds performed
during the time period displayed in the Period column for the Welding Power
Source or Group of power sources you have selected in the Asset Tree. See
page 1.3 for more details on WeldScore™.