App index – Yokogawa PC-Based MX100 User Manual
Page 26
3-7
IM MW180-01E
Viewer
1
2
3
4
5
App
Index
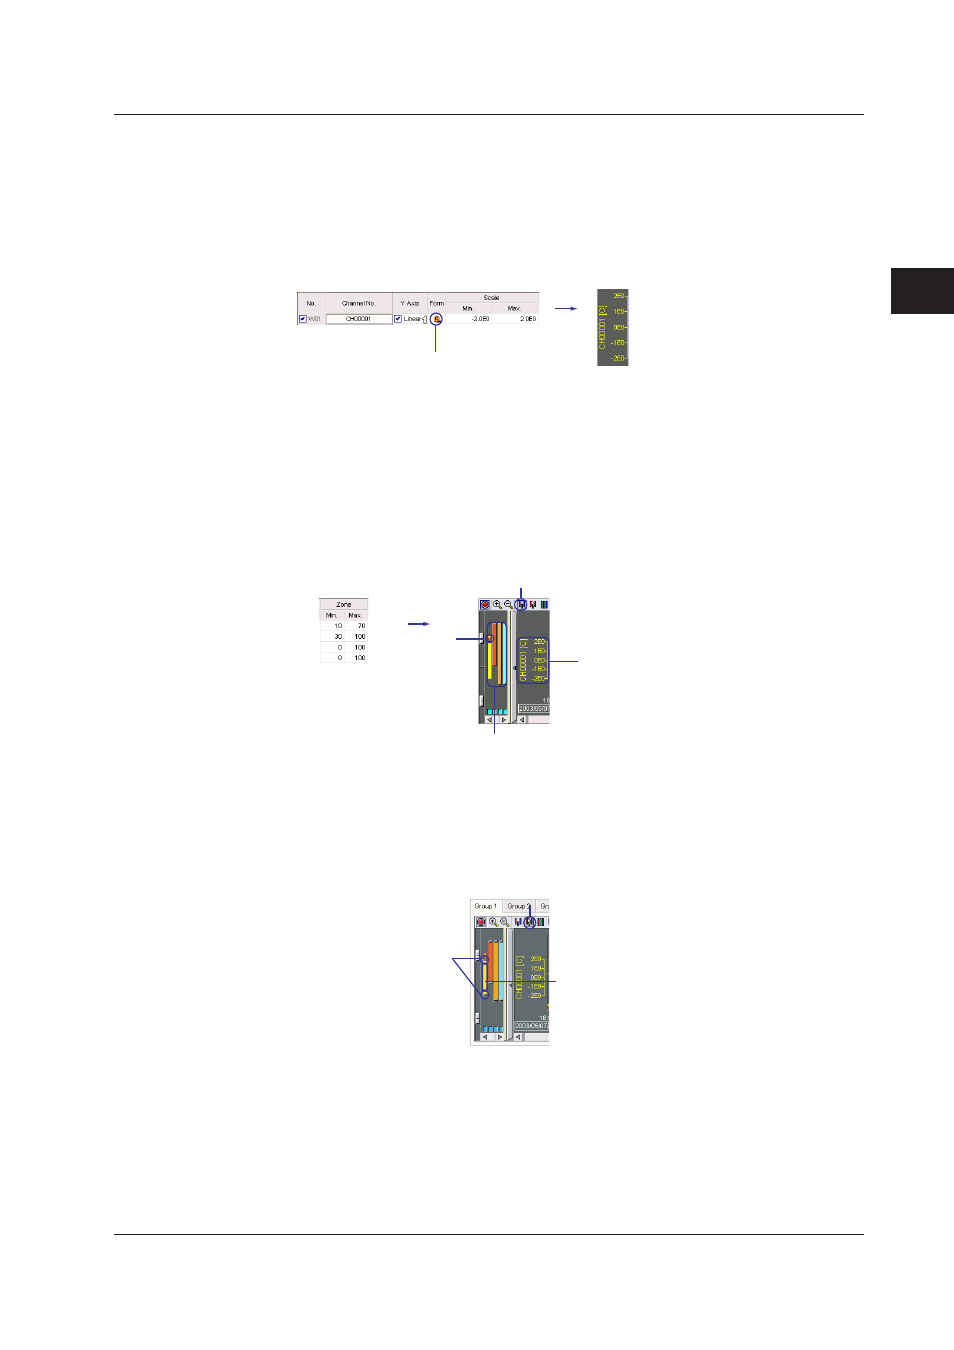
Maximum and Minimum Values of the Y-Axis and the Display Format of the
Y-Axis Values
The maximum and minimum values of the scale on the waveform display can be
changed. If you click the Scale Calc. button on the General Display Settings window, the
maximum and minimum values of the Y-axes on the selected channels are calculated
automatically according to the maximum and minimum values of the data.
The scale values can also be displayed using logarithmic format as shown below.
Select the exponential format
Selecting the Display Zone of the Waveform
You can select from the following. In the Zone setting on the General Display Settings
window, assume the bottom and top edges of the waveform display area to be 0% and
100%, respectively, and set the waveform display position by specifying the minimum
value (0 to 99%) and the maximum value (1 to 100%).
• User zone
Displays each waveform at the position specified by Zone on the General Display
Settings window. A single Y-axis active channel waveform can be displayed.
Select user zone
Click the bar to specify the active channel
Displays the Y-axis
of the active channel
Indicates the
bar for the active
channel
Set the display zone
• Edit zone
Like the user zone, each waveform is displayed at the position specified by Zone
on the General Display Settings window. However, you can change the zone on
the waveform display window. A single Y-axis scale of the active channel can be
displayed.
Select edit zone
Drag the knob to change
the minimum/maximum
value of the zone separately
Drag the bar to change the zone position
without changing the zone width
3.2 Settings Related to Displaying Measured, Computed, and Thinned Data