Luminex xPONENT 3.1 Rev 2 (IVD) User Manual
Page 37
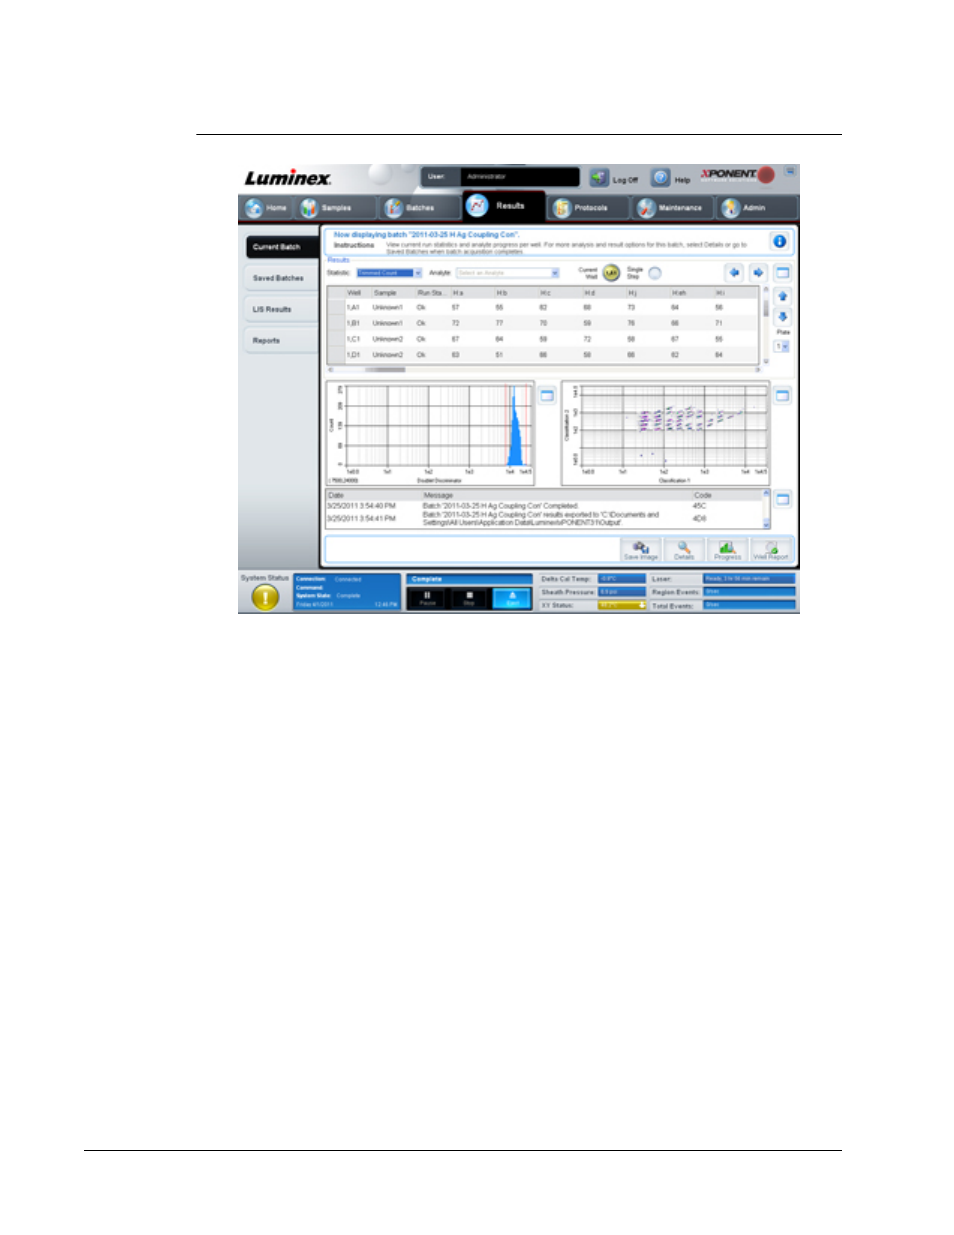
FIGURE 16.
Current Batch Tab
Statistic - To view a particular statistic for analytes in a batch, select one of the following:
• Median - The point in a data set where there are as many values occurring above it as
there are below it.
• Test Result - The calculated analysis value for quantitative or qualitative assays derived
from standards with known values.
• Range - A semi-quantitative result for a particular numerical result falling between a
predefined set of values such as “Normal” or “Negative”.
• Count - Gated events.
• Net MFI (Median Background) - Net MFI median background.
• Mean - Average of all values in a set of results.
• % CV of microspheres - The measure of relative dispersion within the distribution.
%CV = 100 x Std Dev / Mean
• Standard Deviation - For calculating sample variability or dispersion, Luminex uses the
standard deviation formula.
• Peak - The value that is equal to the largest number of data points within the distribution.
For example, in data set {1,2,2,3,3,3,4,5}, 3 is the peak because it occurs the largest
number of times in the distribution list.
• Trimmed Count - The number of data points in the trimmed distribution (Nt).
• Trimmed Mean - The sum of the data points in the trimmed distribution divided by the
number of data points.
Trimmed Mean = Σxi / Nt
For In Vitro Diagnostic Use
Touring the Software
27