3 the different plot window tabs – BNC 7000 Series User Manual User Manual
Page 28
28
3.4.3
The Different Plot Window Tabs
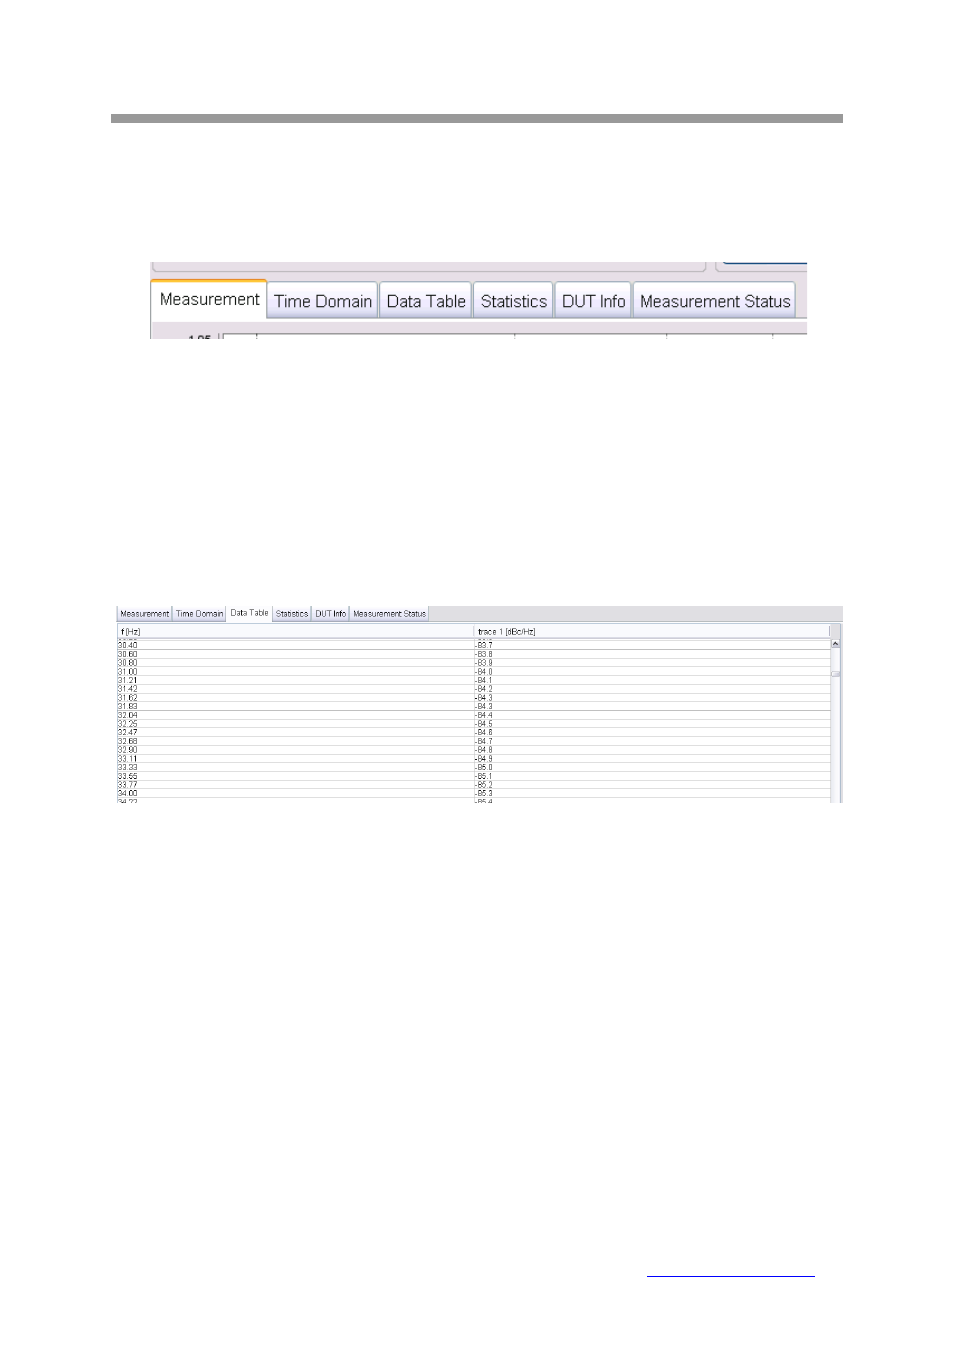
The plot window comprises of six tabs – Measurement – Time Domain – Data Table – Statistics –
DUT Info – Measurement Status:
The Measurement tab is the main tab to display frequency domain results like phase noise.
The Time Domain tab is used to provide time domain measurement information during idle state
(frequency and power detection, calibration) and during the measurement process (locking, and data
acquisition). During the actual measurement, samples of the noise voltage are also displayed in this
window.
The Data Table tab displays the noise measurement data for selected traces as data table. This table
can also be exported to a file (in different formats) with Plot
Save
Data tab displays measured data in ASCII format.
The Statistics tab (as shown in Figure 11) provides additional statistical information such as
integrated jitter, integral phase noise, or Allan variance.
After each correlation the latest measurement is updated in the plot window. The statistic tab displays
the information for the currently selected trace, or if none selected, for the first trace in the trace list.
Berkeley Nucleonics Corporation 2955 Kerner Blvd., San Rafael, CA 94901
Phone: 415-453-9955, Fax: 415-453-9956, Email: [email protected], Web: