N figure 13-2 – RIGOL DSA875 User Manual
Page 64
RIGOL
13-2
User’s Guide for EMI Test System
the X-axis and Y-axis values of this marker are displayed in the marker setting
area.
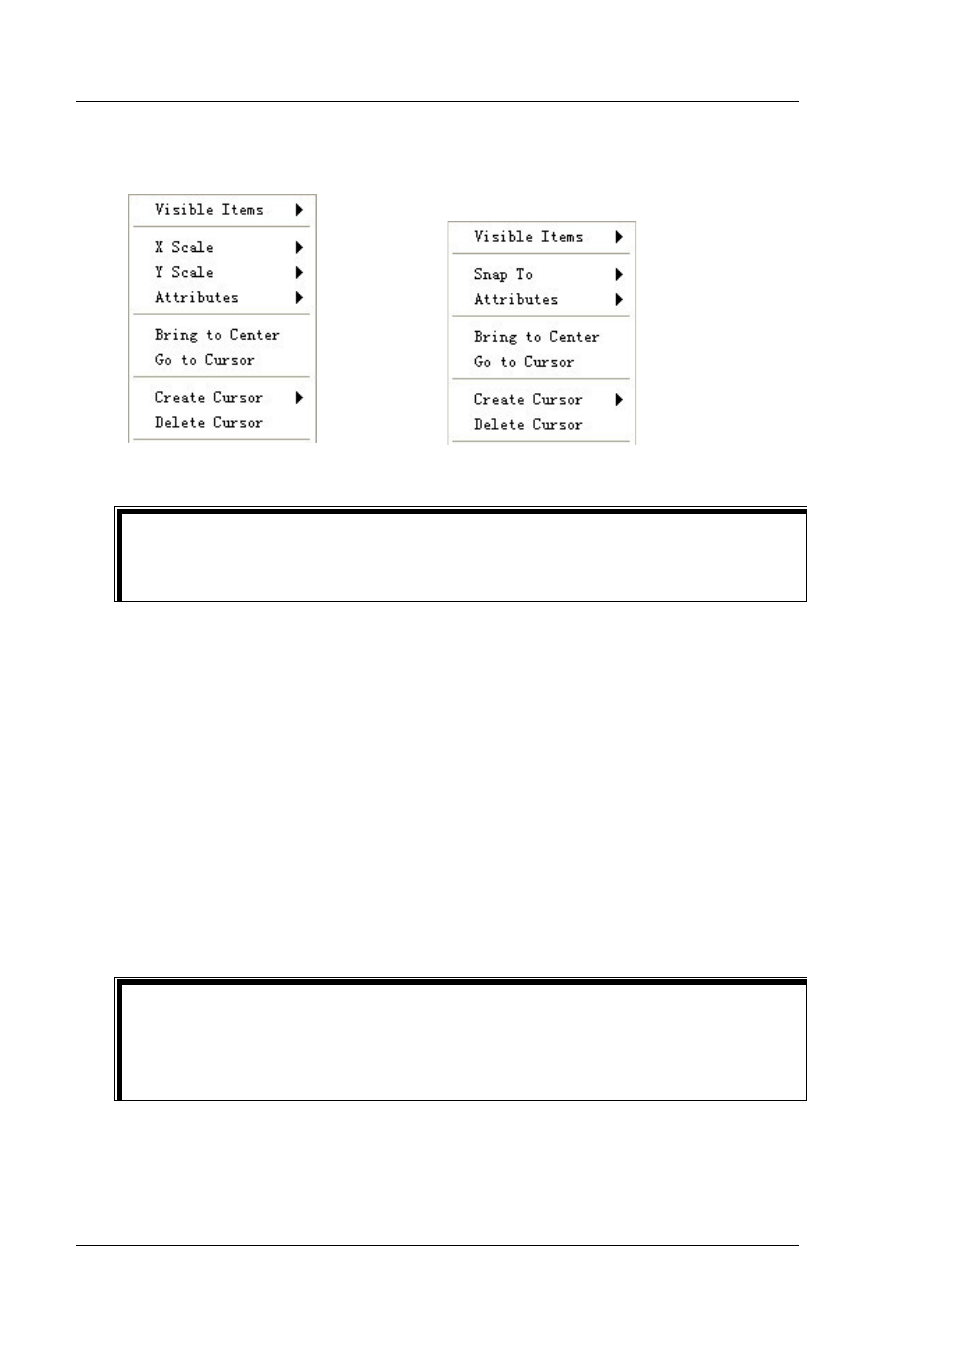
Figure 13-1 Free Marker Menu
Figure 13-2 Single-Plot Marker Menu
Tip:
You can define the name of the current marker by clicking the name (in text
input mode) of the marker in the marker setting area.
1. Set the visible items
Click Visible Items to set the marker setting area to display or not display
the "Horizontal Scrollbar", "Vertical Scrollbar" and "Column Headers".
2. Select the X scale and Y scale of the marker (free)
By default, the X axis denotes frequency and Y axis denotes amplitude.
3. Set the associated item of the marker (single-plot)
When multiple curves are displayed in the spectrum window, you can move
the current marker onto a curve by clicking Snap To and selecting the
corresponding curve item.
Tip:
When the pre-scan range is defined as multiple sub-ranges (namely segment
scan), each sub-range corresponds to a segment of scan curve and the marker
can be associated with different scan curve segment.
4. Set the marker attributes
Click Attributes; you can set the color, cursor style, point style, line style and
line width of the marker in the popup menu. In addition, you can also enable