RIGOL DSA875 User Manual
Page 31
RIGOL
User’s Guide for EMI Test System
3-3
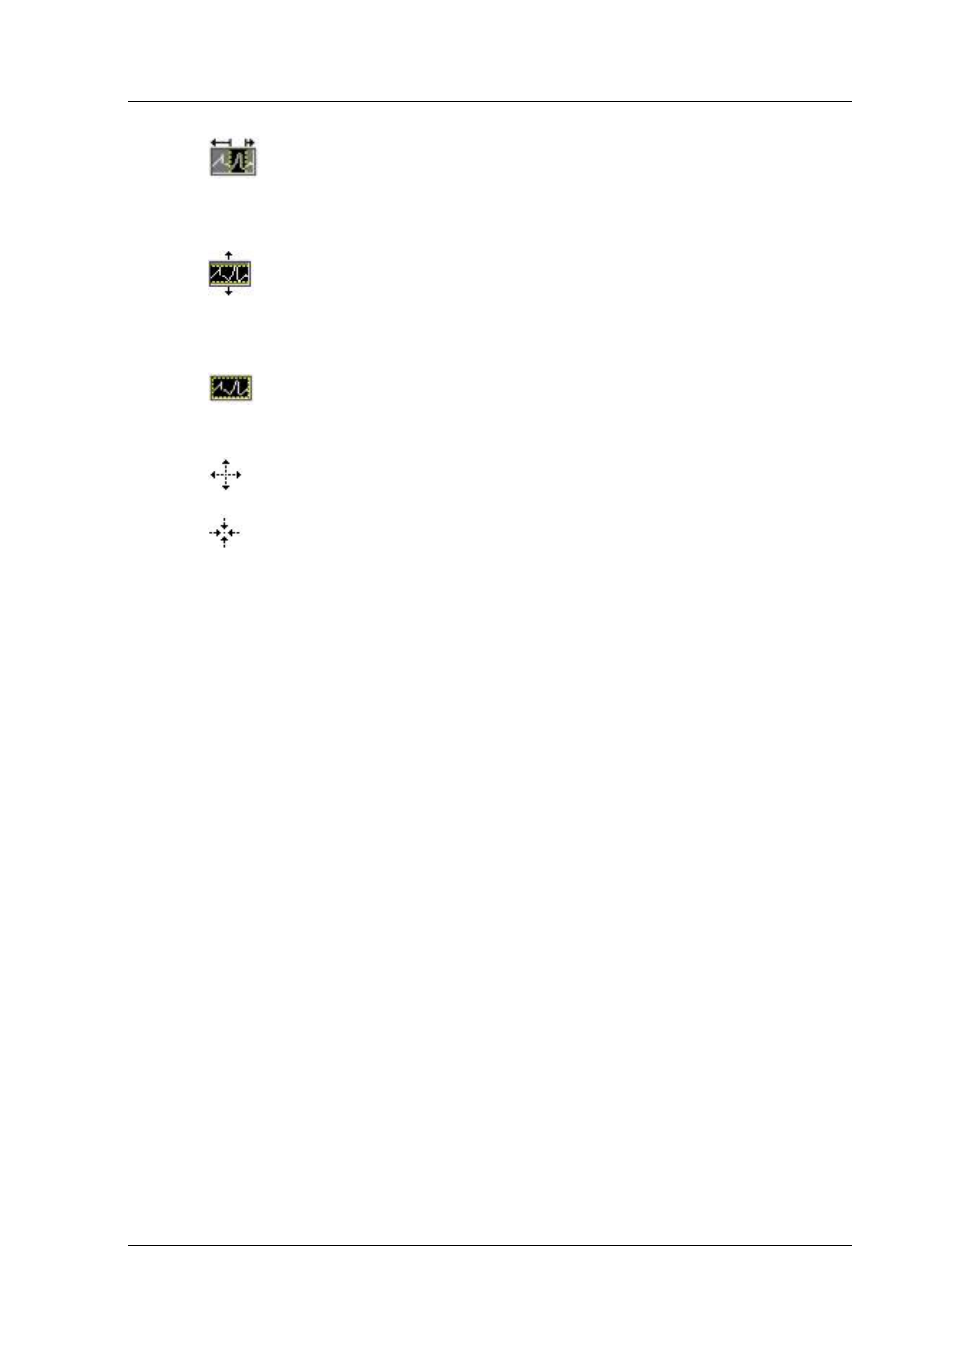
: select the spectrum within the specified horizontal axis range by
clicking and dragging the mouse. After that, only the spectrum within the
specified horizontal axis range is displayed.
: select the spectrum within the specified vertical axis range by
clicking and dragging the mouse. After that, only the spectrum within the
specified vertical axis range is displayed.
: click this icon to restore the spectrum currently displayed to its
initial state.
: click the mouse to zoom in the spectrum currently displayed.
: click the mouse to zoom out the spectrum currently displayed.
7. Generate a report
Click this key and configure the related parameters in the popup Report
Configuration interface. Then, click OK to store the current test report
(*.html) to the specified location.
8. Help information
Click this key to recall the corresponding help document of EMI Test
System.
9. Spectrum window
It is the main part of the software interface and is used to display the
spectrum, frequency axis (X axis), amplitude axis (Y axis), limit line and
marker. Besides, you can set the scale values of the X axis and Y axis in the
spectrum window manually.
10. Marker setting area
Right-click in this area to create a marker ("Free" or "Single-Plot") and set the
related parameters of the marker. You can read the frequency/amplitude
values at a certain point on the signal trace in the spectrum window using the
marker.