A-2 inverter efficiency, A-3 ac input voltage to output charge amps, Eff ici e n cy wattage – Magnum Energy MS-G Series User Manual
Page 63: Appendix a – specifi cations, A-2 inverter effi ciency
©
2015 Sensata Technologies
Page 55
Appendix A – Specifi cations
E
ff
ici
e
n
cy
Wattage
42
00
20
0
60
0
10
00
14
00
30
00
18
00
22
00
26
00
34
00
38
00
60%
65%
70%
75%
80%
85%
90%
95%
MS2000-G/MS2012-G
MS2812-G
MS4024-G
MS2000-G/
MS2012-G
MS
28
12-
G
MS4024-G
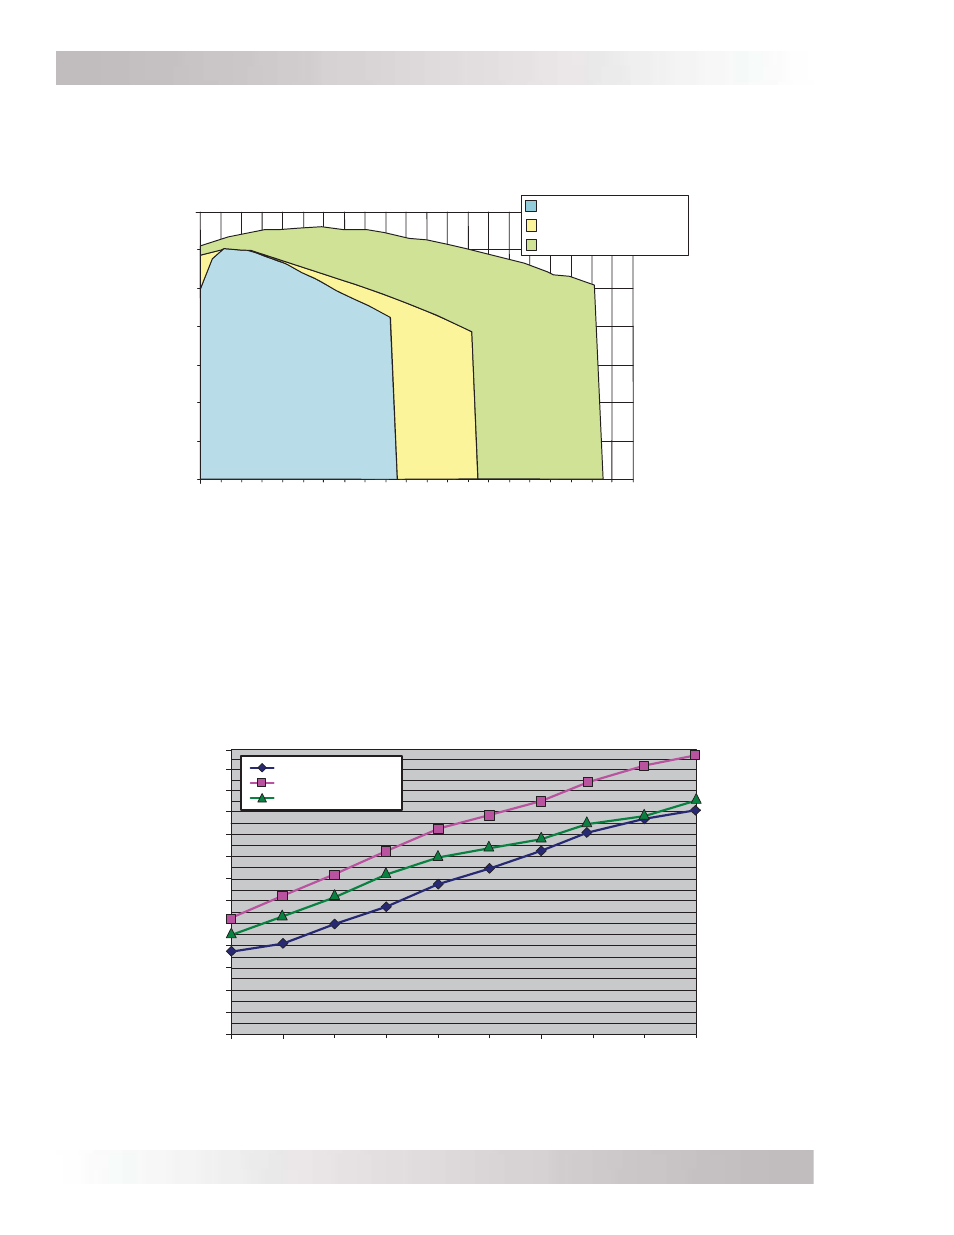
A-2 Inverter
Effi ciency
The curves in Figure A-1 are plotted to show the MS-G Series’ effi ciency over the full power range
(displayed as a percentage). This graph represents the inverter’s effi ciency while operating resistive
loads. Motors and other inductive loads run less effi ciently due to the impact of power factor losses.
Figure A-1, MS-G Series Effi ciency Chart
A-3 AC Input Voltage to Output Charge Amps
The following chart shows the expected charger output capability of the MS-G Series. The maximum
charge current is dependent on the AC input voltage and the inverter battery voltage.
Note: The output charger current shown is with the inverter battery voltage at nominal (i.e., 25.2
volts for MS4024-G).
Figure A-2, MS-G Series VAC Input to Charge Amps
140
150
160
95
105
115
125
135
VAC Input
Peak
C
h
arge
A
m
ps
100
110
120
130
140
130
120
110
100
90
80
70
60
50
40
30
MS2000-G/MS2012-G
MS2812-G
MS4024-G