4 interpreting the measure bars, Ph 12.5.4 – Grass Valley Channel Composer v.1.6.2 User Manual
Page 86
Channel Composer User Manual - Channel Composer User Manual- document version: 1.6.2 - 85
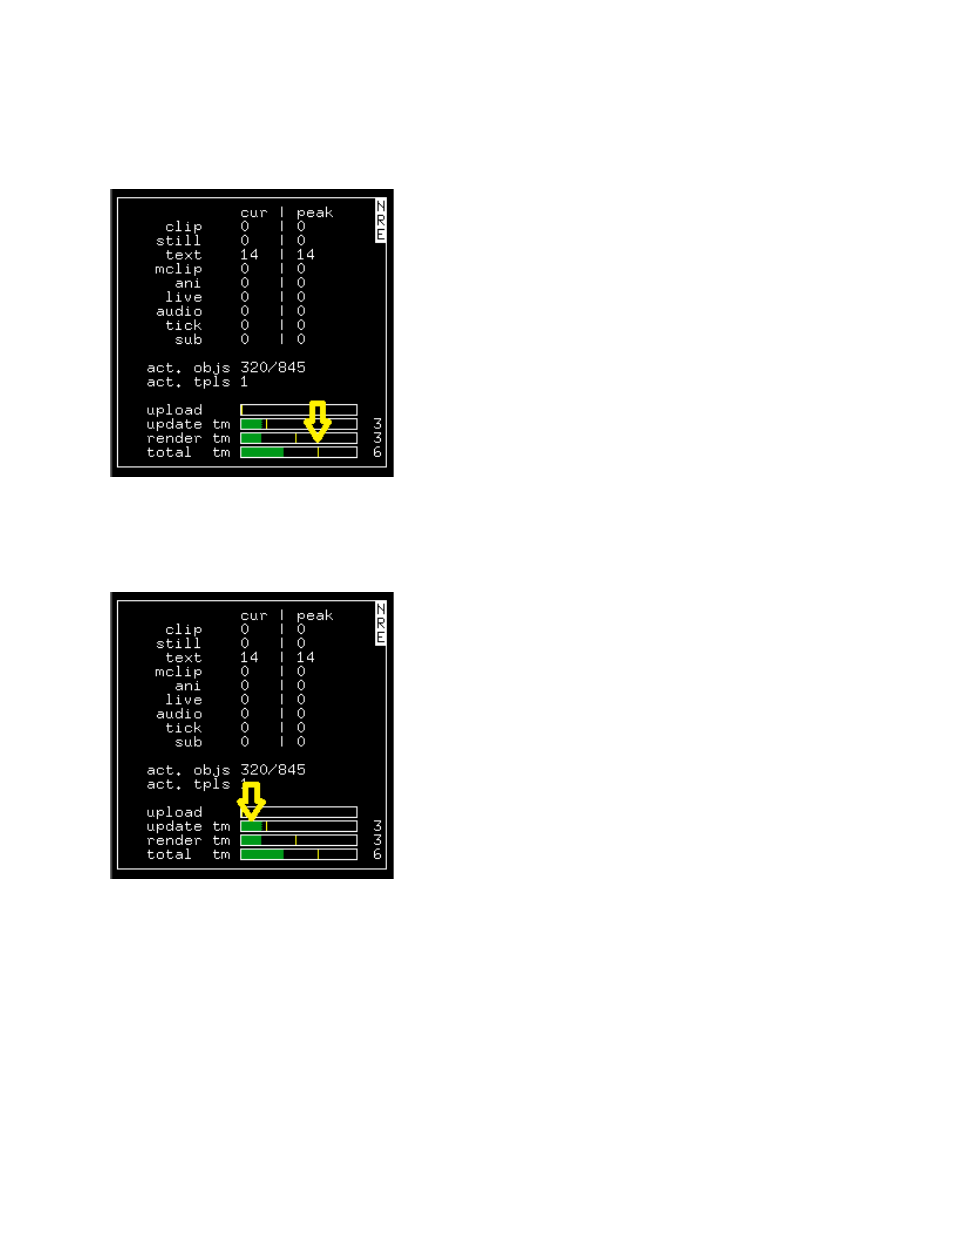
11.5.4 Interpreting the measure bars
The vertical yellow line shows peak values that have been measured:
Example.
The green or red horizontal bar shows current values. Red indicates that high values are measured, green
indicates that values are within safe margins:
Example.
See also other documents in the category Grass Valley Equipment:
- LDK 5302 (24 pages)
- SFP Optical Converters (18 pages)
- 2000GEN (22 pages)
- 2011RDA (28 pages)
- 2010RDA-16 (28 pages)
- 2000NET v3.2.2 (72 pages)
- 2000NET v3.1 (68 pages)
- 2020DAC D-To-A (30 pages)
- 2000NET v4.0.0 (92 pages)
- 2020ADC A-To-D (32 pages)
- 2030RDA (36 pages)
- 2031RDA-SM (38 pages)
- 2041EDA (20 pages)
- 2040RDA (24 pages)
- 2041RDA (24 pages)
- 2042EDA (26 pages)
- 2090MDC (30 pages)
- 2040RDA-FR (52 pages)
- LDK 4021 (22 pages)
- 3DX-3901 (38 pages)
- LDK 4420 (82 pages)
- LDK 5307 (40 pages)
- Maestro Master Control Installation v.1.5.1 (455 pages)
- Maestro Master Control Installation v.1.5.1 (428 pages)
- 7600REF Installation (16 pages)
- 7600REF (84 pages)
- 8900FSS (18 pages)
- 8900GEN-SM (50 pages)
- 8900NET v.4.3.0 (108 pages)
- Safety Summary (17 pages)
- 8900NET v.4.0.0 (94 pages)
- 8906 (34 pages)
- 8911 (16 pages)
- 8900NET v.3.2.2 (78 pages)
- 8914 (18 pages)
- 8912RDA-D (20 pages)
- 8916 (26 pages)
- 8910ADA-SR (58 pages)
- 8920ADC v.2.0 (28 pages)
- 8920ADC v.2.0.1A (40 pages)
- 8920DAC (28 pages)
- 8920DMX (30 pages)
- 8920ADT (36 pages)
- 8920MUX (50 pages)
- 8921ADT (58 pages)