An overview of the overview, Spectrafootdm operation guide 30 – Metric Halo SpectraFoo Version 1.5 User Manual
Page 31
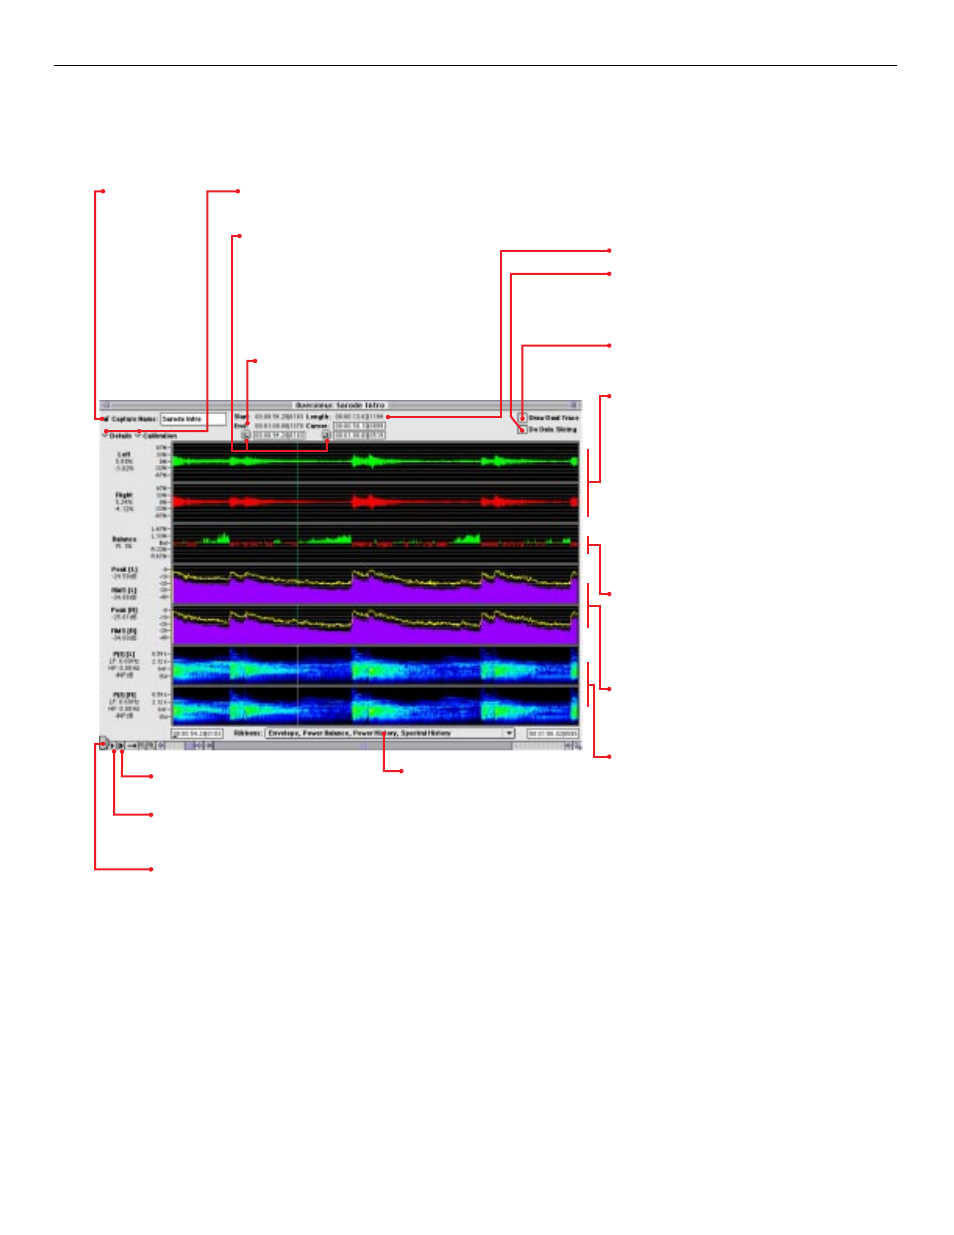
An Overview of the Overview
Click on this lock
to activate the
text field that al-
lows you to name
the capture.
Click on these disclosure arrows to show/hide the details and calibrations for the overview window ribbons. The details provide
precise numerical readings of the values of each display at the point of the capture which lies underneath the cursor.
The Envelope overview shows the amplitude envel-
ope history of the captured waveform. This is a very
common display for digital audio editing and can be
a helpful point of reference. You can zoom in to dis-
play the capture on a sample by sample basis. When
captures are played back, the cursor moves across
the ribbons until it gets near the end of the window.
At this point, the ribbons begin to scroll very smoothly
creating the effect of animation. As a result, when
you have the envelope overview zoomed in all the
way and play the capture, the display can function
as a nifty storage oscilloscope (most storage scopes
are not capable of playback).
The Power Balance ribbon is an overview history of
the left/right power balance meter in the realtime
rack. Drag the cursor along the ribbon and the De-
tails readout will track the amount that the power in
one channel exceeds the other as a percentage of
the sum of the total power in both channels.
The Power History ribbon is an overview history of
the PPM and RMS meters. The details readout will
track the Peak and RMS levels for the part of the
display which lies under the cursor.
The Spectral History ribbon is an overview history
of the Spectragram from the realtime rack. This dis-
play is incredibly effective at revealing minute de-
tails of musical and sonic structure. When you hold
down the option key and click the mouse in the rib-
bon, a marker will appear to the right of the frequency
calibration giving a rough indication of the frequen-
cy of the spectral feature you are pointing at with
the mouse pointer. The details readout will track the
precise frequency range of the display feature you
are pointing at. This will be described in more detail
in the next illustration.
This is a pop up menu which allows you
to select which ribbons will be displayed
in the Capture Overview Window. Se-
lecting an item in the ribbons popup
menu toggles it on and off. If you hold
down the option key and select a rib-
bon, all other ribbons will be hidden. This
allows you to utilize the entire Capture
Overview Window to view a particular
ribbon. This is illustrated in the next
picture.
Clicking this button causes the capture to
play from the beginning
Clicking this button causes the capture to
start playing from wherever the cursor is in
the ribbon.
Click this button to stop playback.
Clicking this check box will cause the envelope rib-
bon to display the left and right channels superim-
posed on top of each other.
Clicking this check box will cause the “slice” of data
that lies underneath the cursor to be displayed by
the realtime instruments. This will be described in
more detail below.
These show the start and end times of the
capture referenced to the timecode of the
source.
This indicates the length of the capture.
These buttons set the start and end times of a loop.
When you click one of the buttons, the timecode val-
ue of the current cursor position will be copied into
the corresponding timecode field. Click in the appro-
priate field to edit loop start and end points from the
keyboard. You can also use the mouse to edit loop
points in realtime. This will be described in detail in
the section on looping captures.
SpectraFooTDM Operation Guide
30