Peak hold trace, Averagetrace, Instantaneous trace – Metric Halo SpectraFoo Version 1.5 User Manual
Page 11: Spectragram, Spectrafoo operation guide 10
Although the Spectragraph excels at traditional applications such as analyzing the distortion characteristics of audio
equipment, its true strength lies in its sheer speed. SpectraFoo’s Spectragraph is fast enough to create a highly
detailed, animated “movie” of sonic events. If you have been watching SpectraFoo monitor a favorite album of yours
while reading this guide, you probably have already noticed this.
Because the Spectragraph is so completely synchronized with the material it is monitoring, the information it dis-
plays can be experienced in a sensory rather than intellectual way – much the same way as you experience music
itself. The key to making the most out of the Spectragraph (as well as all of the other instruments) is to spend some
time listening to and looking at your favorite music – music that you know really well. After a relatively short amount
of time, details of the recordings such as phase structure, overall spectral balance, dynamic range, frequency range,
and low frequency roll-off will literally leap out at you. You will be experiencing, rather than thinking about, quan-
titative analysis.
The Spectragraph utilizes a triple display. The bright green trace provides instantaneous spectral analysis. The pur-
ple trace shows the average spectral content referenced over a user specified length of time; this is controlled from
the Details window. The dark green trace represents the peak spectral power monitored since the peak was last reset.
Using the Details window, you can alter the Spectragraph’s frequency and power scaling as well as its averaging
characteristics in realtime. This allows you to focus on very fine details easily.
Real–Time Spectral Power History (Spectragram)
The Spectragram utilizes the same FFT resolution and scale as the Spectragraph. The display medium correlates not
only frequency and power, but also time. The result is a visual “sonic fingerprint”. Like the Spectragraph, the true
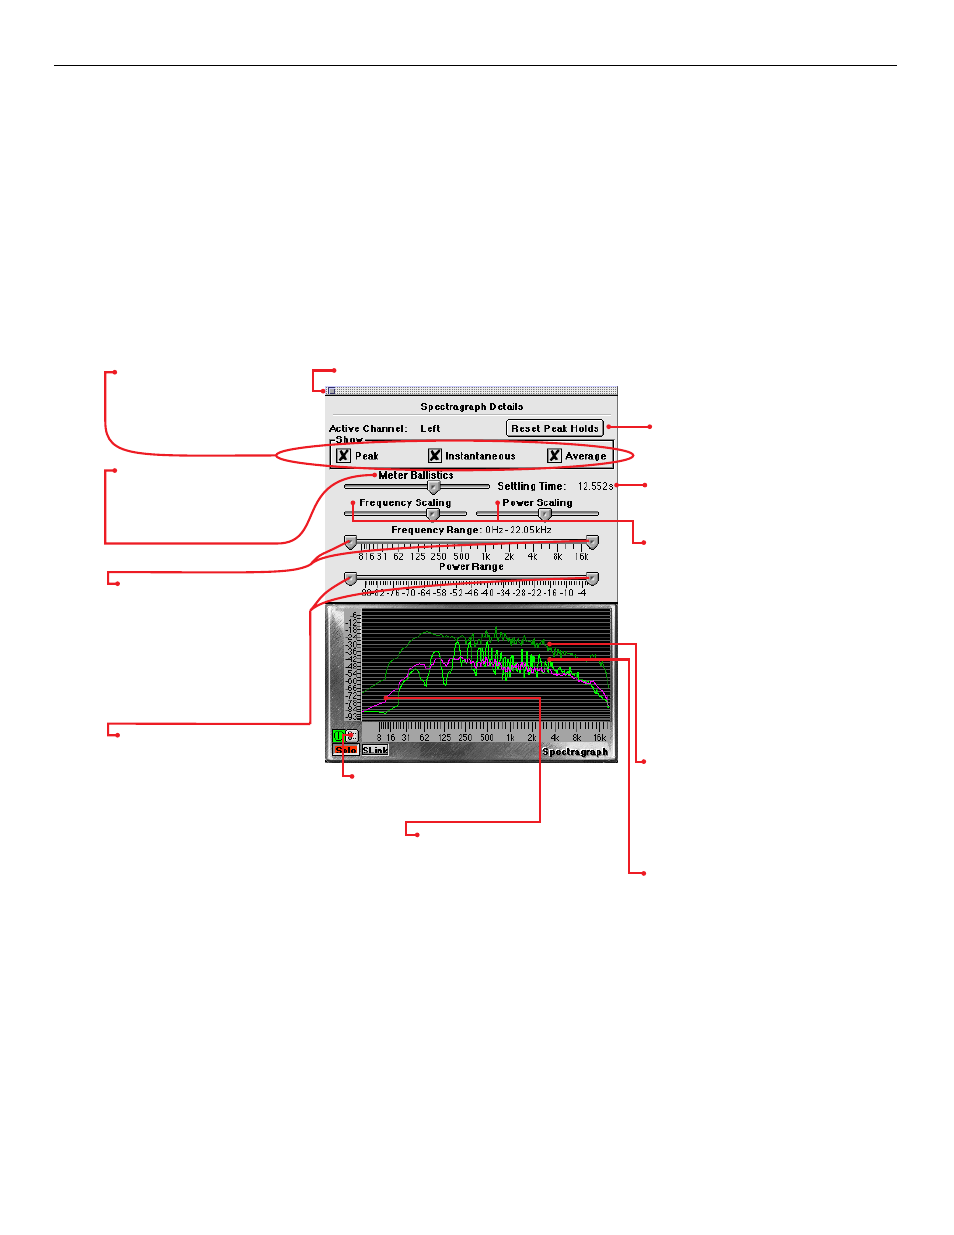
Peak Hold Trace: Displays the maximum
amplitude per frequency bin since the
peak hold was last reset. To reset the
peak hold either click on the instrument
itself or click on Reset Peak Holds in the
details window.
Instantaneous Trace: Displays the current
level of the signal at each frequency.
AverageTrace: Displays the average
level of the signal at each frequency.
These checkboxes show and hide
the traces, allowing you to focus
your attention on any combination
of traces.
Click to reset the peak trace.
Sets the averaging rate for the
average trace. When you move
this slider, the ballistics of the
average trace will change in
realtime.
Gives a precise numerical reading of
the settling time of the average trace.
Use these sliders to change the low
and high frequency limits that the
spectragraph applies to its display.
This lets you zoom in on a partic-
ular frequency range. As you
change the low and high frequen-
cy limits, the frequency calibration
on the bottom of the spectrograph
will instantly rescale itself.
Use these sliders to change the low
and high power limits that the
spectragraph applies to its display.
This lets you zoom in on a particu-
lar power range. As you change
the low and high frequency limits,
the power calibration on the left
side of the spectragraph will in-
stantly rescale itself.
The Frequency Scaling and Power
Scaling sliders allow you to adjust the
scaling of the frequency and power
calibrations. When the slider is set to
its far left limit, the scale is roughly lin-
ear. When the slider is set to its right
limit, the scale is logarithmic. The best
way to get a feel for scaling, is to simp-
ly grab a slider and move it back and
forth.The frequency and power calibra-
tions will track your movements in real-
time and useful scaling settings will
quickly become obvious.
Click on this button and the
Spectragraph Details window will
pop up above the instrument.
Click the close box to close the Details window
SpectraFoo Operation Guide
10