Peak and rms power history, Envelope history, Power balance history – Metric Halo SpectraFoo Version 1.5 User Manual
Page 13
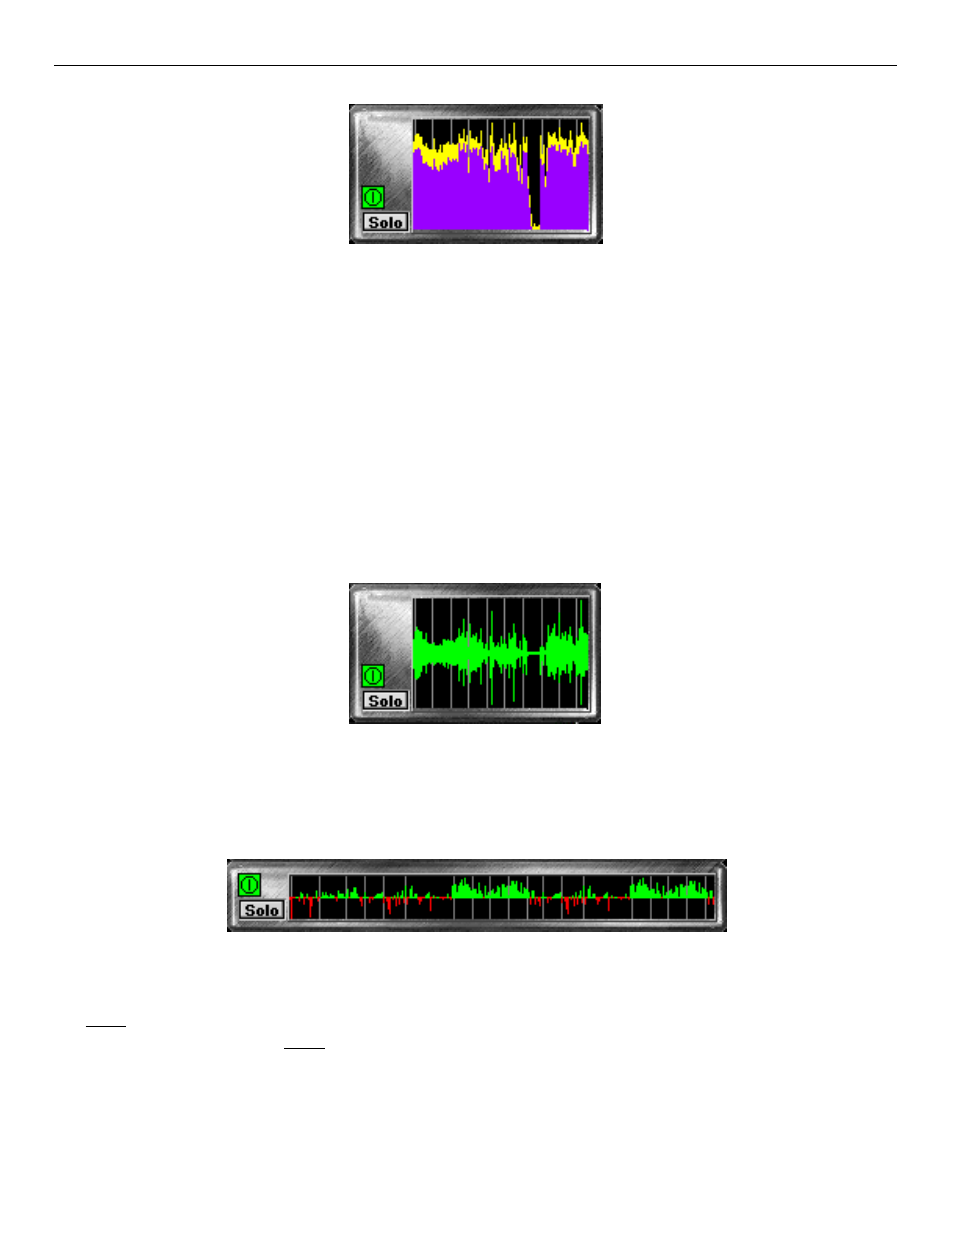
Peak and RMS Power History
This instrument allows you to see the history of the information displayed by the Peak and RMS meters. The light
grey “tick” marks indicate the passage of one second of time, and the height of the each color for each time “slice”
indicates the Peak (yellow) & RMS (purple) power levels of the program. The ratio between these two levels is
responsible for the “perceived” volume” of program material. When there is a large difference between the Peak and
RMS levels of program material, the perceived volume will be low as compared to the peak levels on the tape.
Conversely, when the difference between Peak and RMS levels is small, the perceived volume will be louder. This
instrument can help you determine how much compression and limiting is needed for specific program material. If
you have a full-featured mastering compressor, this display can also help you determine whether the compressor
should be set to react to Peak or RMS levels.
Note: This meter is scaled logarithmically in decibels. When the average level is high, the signal can change rela-
tively dramatically in level without creating a large change in the display. In this situation it is useful to refer to the
envelope history display which is described below.
Envelope History
This instrument is a sample–editor–style scrolling envelope overview. It can help you calibrate your eyes if you are
experienced with DAW-style displays. Because it uses linear scaling, it is useful for identifying large level changes
when the average level is high. It should be used in conjunction with the Peak and Average History display to obtain
a good view of the overall dynamics of program material.
Power Balance History
The Power Balance History compares the power balance between the two input channels as a function of time. When
the power level on the first input channel is greater than the second input channel the display turns green and shifts
above the centerline. When the power level on the second input channel is greater than the first input channel, the
display turns red and shifts below the centerline. The length of the indicator expresses the difference in power
between the right and left sides as a percentage of the total power present in both signals. The light grey lines appear
once per second as the history scrolls to the left. This meter is very helpful for precisely identifying the aspects of
mixes that don’t have a natural flow of energy between the left and right channels. It is also great for power-balanc-
ing natural stereo recordings and two channel measurements of equipment.
SpectraFoo Operation Guide
12