Monitor – Ubiquiti Networks PowerBridgM User Manual
Page 15

12
Chapter 3: Main Tab
airOS
™
v5.5.4 User Guide
Ubiquiti Networks, Inc.
TX Rate/RX Rate
(Available in Station mode only.)
Displays the current 802.11 data transmission (TX) and
data reception (RX) rates.
airMAX
Indicates the airMAX status. If airMAX is enabled,
the device will only accept airMAX clients. airMAX also
features advanced QoS autodetection settings. For more
information, refer to “airMAX Settings” on page 4.
Note:
For compatibility, legacy or 802.11 a/b/g
devices should use legacy firmware with airMAX
support (such as airOS firmware v4.0). Legacy
clients can only work as airMAX clients with the M
Series device acting as an airMAX AP.
airMAX Priority
Available if airMAX is enabled in Station
mode only. Indicates the airMAX Priority set on the Ubiquiti
logo tab. By default the AP gives all active clients the same
amount of time. However, if the clients are configured with
different priorities, the AP will give clients more or less
time, depending on the priority.
airMAX Quality
Available if airMAX is enabled. airMAX
Quality (AMQ) is based on the number of retries and the
quality of the physical link. If this value is low, you may
have interference and need to change frequencies. If AMQ
is above 80% and you do not notice any other issues, then
you do not need to make any changes.
airMAX Capacity
Available if airMAX is enabled. airMAX
Capacity (AMC) is based on airtime efficiency. For example,
if you have one client with a low data rate or you are using
a 1x1 device (such as Bullet or airGrid) alongside other
clients that are 2x2, then it will use up more airtime (slots)
for the same amount of data, reducing time (or capacity)
for other clients. The lower the AMC, the less efficient the
AP is. If you only have one client, this may not matter, but
when you have many clients (for example, more than 30),
then AMC becomes very important, and you want it to be
as high as possible.
If you are looking at the client, AMC shows the theoretical
capacity of that client, based on current TX/RX rates and
quality. AMC is a percentage based on what the maximum
performance would be if the link were perfect. Clients
with poor airtime efficiency can negatively affect other
clients by taking up more airtime while transmitting at
lower speeds. For example, client A is at MCS 12 (78 Mbps)
because of low signal. The client could theoretically
do MCS 15 (130 Mbps), so AMC is based on the ratio
of current rate/maximum rate (78 Mbps divided by
130 Mbps), which is 60%. In a similar fashion, a 1x1 device
will always have a maximum AMC of 50%, because it
provides half the performance of a 2x2 device.
If you are looking at the AP, then AMQ and AMC are
averages of all clients’ values. If you want to discover
what is lowering your values on heavily populated APs,
single out the weak clients. You can either use airControl
™
(recommended), or you can go to each client individually.
Try to upgrade to a higher-gain antenna (to allow a better
data rate), or upgrade to a 2x2 device if you are using a
1x1 device.
airSelect
Indicates the airSelect status. If airSelect is
enabled, airSync is not available. Access airSelect setup
through the Ubiquiti Logo tab > airSelect.
Hop Interval
Available if airSelect is enabled. The duration
(in milliseconds) that the AP will stay on one frequency
before moving to the next.
airSync (GPS Series Only)
Indicates the airSync status. If
airSync is enabled, airSelect is not available, and the device
in Master mode reports the number of airSync-enabled
devices in Slave mode. Access airSync setup through the
Ubiquiti Logo tab > airSync.
GPS Signal Quality (GPS Series Only)
Displays GPS
signal quality as a percentage value on a scale of 0-100%.
Latitude/Longitude (GPS Series Only)
Based on
GPS tracking, reports the device’s current latitude and
longitude. Clicking the link opens the reported latitude
and longitude in a browser using Google Maps
™
(
).
Altitude (GPS Series Only)
Based on GPS tracking,
reports the device’s current altitude above sea level.
Custom Scripts
Displayed if custom scripts are present
on the device. If custom scripts are running, then the Main
tab displays the status of this option as “Enabled”.
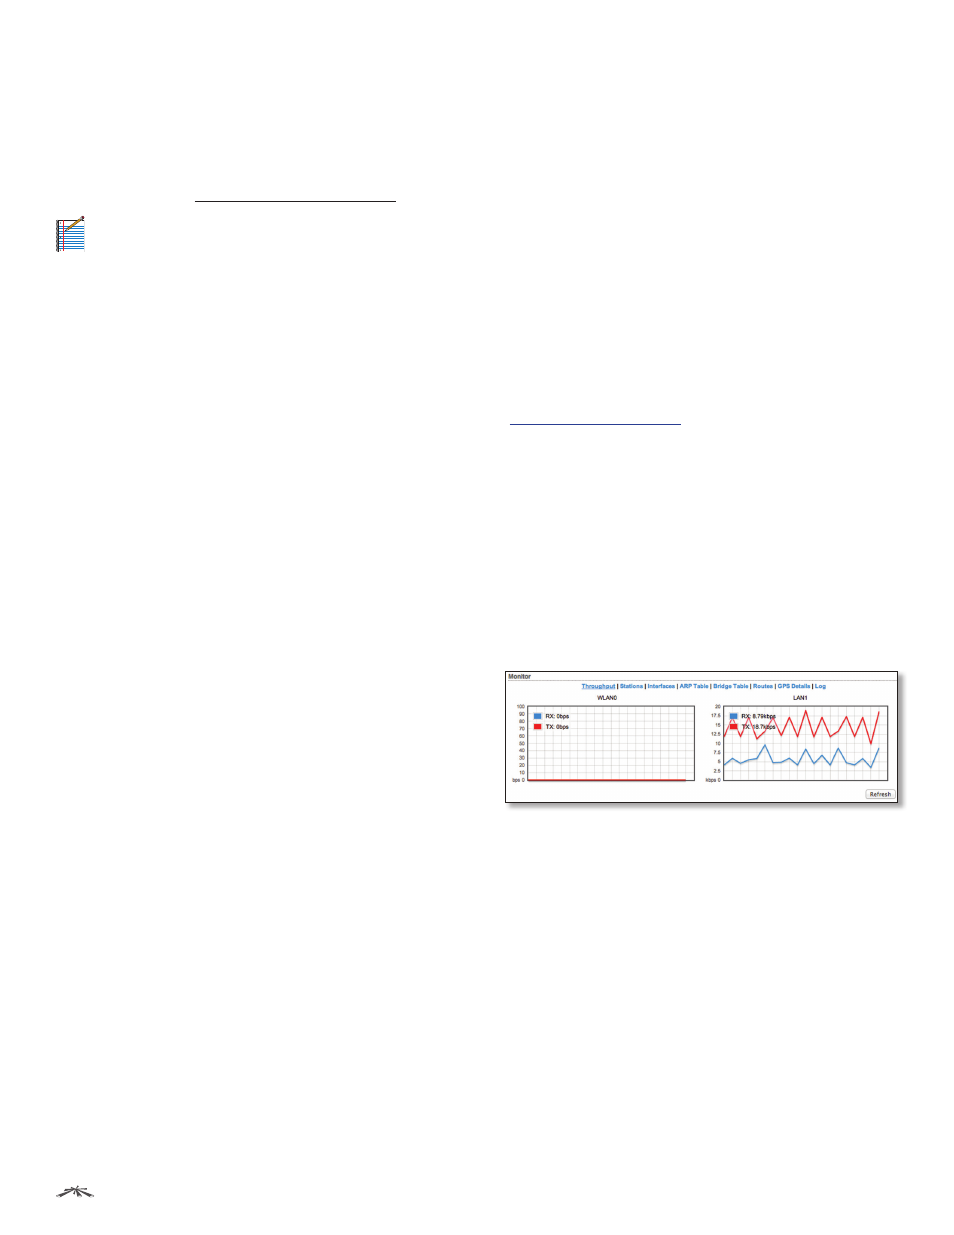
Monitor
There are various monitoring tools accessible via the
links on the Main tab. The default is Throughput, which is
displayed when you first open the Main tab.
Throughput
Throughput displays the current data traffic on the LAN
and WLAN in both graphical and numerical form. The
chart scale and throughput dimension (Bps, Kbps, Mbps)
change dynamically depending on the mean throughput
value. The statistics are updated automatically.
Refresh
If there is a delay in the automatic update, click
Refresh to manually update the statistics.
