E-85 – Casio fx-5800P User Manual
Page 86
E-85
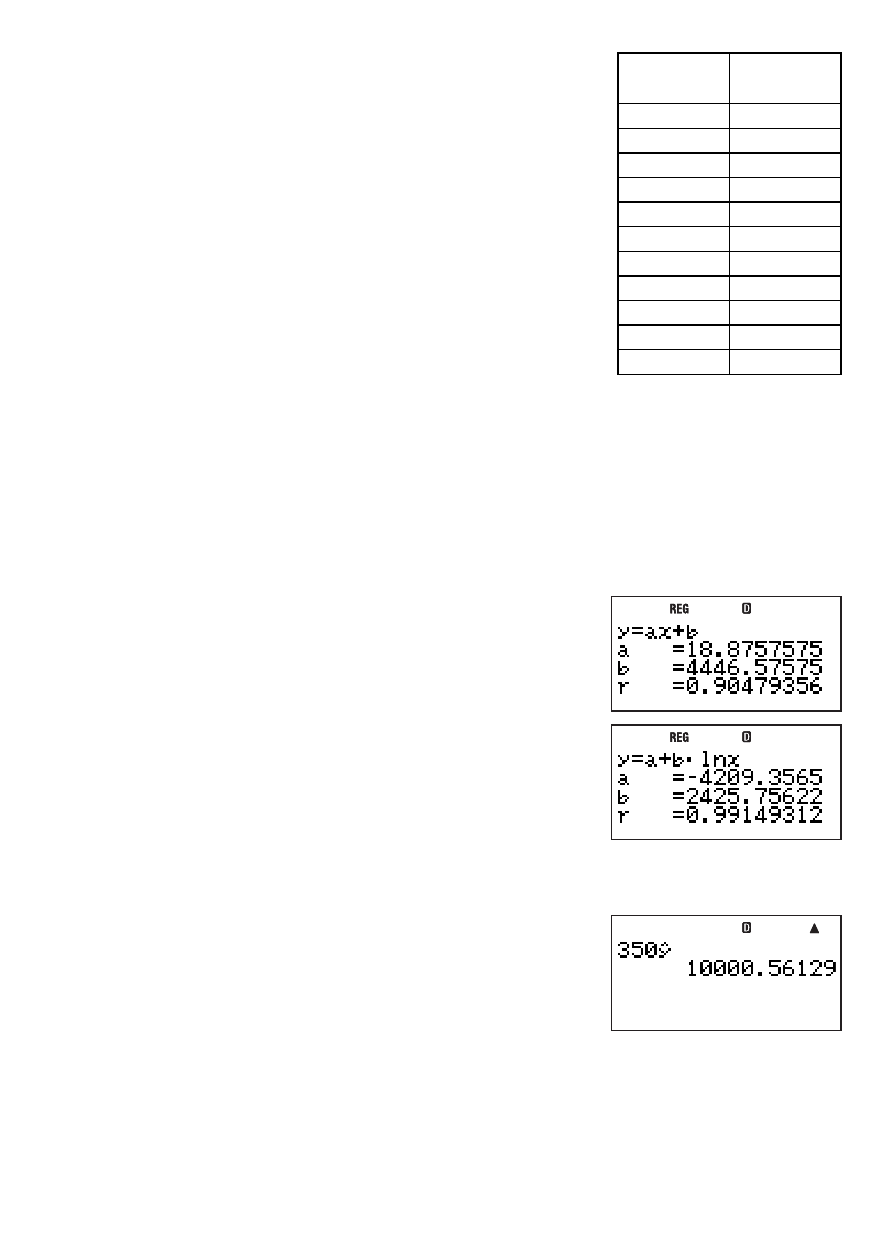
Example 2: The nearby data shows how the weight of a
newborn at various numbers of days after birth.
1 Obtain the regression formula and correlation coeffi cient
produced by linear regression of the data.
2 Obtain the regression formula and correlation coeffi cient
produced by logarithmic regression of the data.
3 Predict the weight 350 days after birth based on the
regression formula that best fi ts the trend of the data in
accordance with the regression results.
Number
of Days
Weight
(g)
20
3150
50
4800
80
6420
110
7310
140
7940
170
8690
200
8800
230
9130
260
9270
290
9310
320
9390
Operation Procedure
Select the REG Mode:
N4(REG)
Select FreqOff for the statistical frequency setting:
1N(SETUP)c5(STAT) 2(FreqOff)
Input the number of day data into the X-column:
20E50E80E110E140E170E
200E230E260E290E320E
Input the weight data into the Y-column:
ce3150
E4800E6420E7310E
7940E8690E8800E9130E
9270E9310E9390E
(1) Linear Regression
Display the linear regression calculation result screen:
z6(RESULT) 2(Reg)1(Line)
(2) Distribution Logarithmic Regression
Display the logarithmic regression calculation result screen:
Jz6(RESULT) 2(Reg)3(Log)
(3) Weight Prediction
The absolute value of correlation coeffi cient r is close to 1, so logarithmic regression is used
for its calculation.
Obtain
n when
x
= 350:
Jz1(/ COMP)350z7(STAT)
2(VAR) ccc7(n)E