ALTANA Temp-Chart User Manual
Page 39
38
High
indicates for how long the curve
was at the upper threshold
value
Max
indicates for how long the curve
was at the maximum threshold
value
Note: The first two lines in the header show the
set threshold values and duration times; to change
them, please use the Curing conditions page.
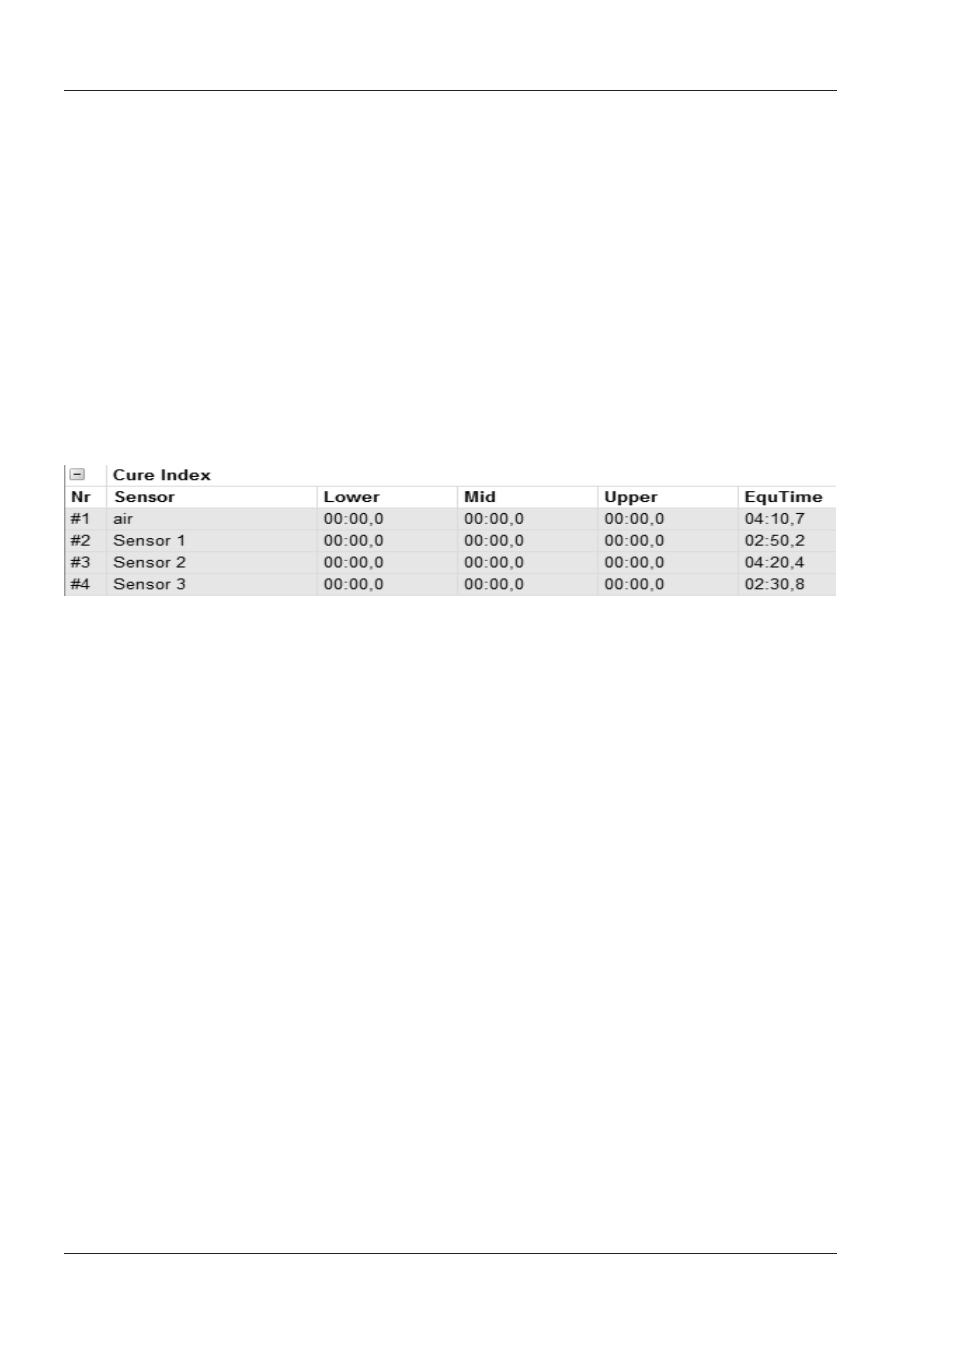
4.2.2.2 Cure Index
The table Cure index permits a simple evaluation
of the curing process. Here the Cure index - a
measure for the quality of the hardening process
- is computed. An optimal Cure index of 100% is
reached, if the equivalence time for the respective
sensors is calculated and indicated in the column
Equ Time corresponds with the period passed at
the reference temperature (middle temperature).
Similar to the results in the „Critical Values“
section, the „Equivalent Time“ index is calculated
to indicate the quality of the heating process:
The table of results consists of four columns:
Low
indicates for how long the curve
was at the lower threshold value
Mid
indicates for how long the curve
was at the mean threshold value
Upper
indicates for how long the curve
was at the upper threshold value
Equ Time
indicates the corresponding
equivalent heating time
(see Equivalent Time)
Data Values Analysis Results