ALTANA Temp-Chart User Manual
Page 36
35
• move the axes with the mouse or
• draw a square over the section, which interests
you, by keeping the mouse button pressed.
A following double click indicates the cutout (See
section: Scale Axes).
• the tolerance curve, which can be indicated or
hidden with the button T in the sensor window.
With the scaling of the temperature and time axes
preset by the program, the entire measurement is
visible. However, you can also select a fixed scaling
in the axis section of the View-menu in order to be
able to easily compare various measurements. Here,
you can also determine if and where distance and
zone axes shall be drawn, whether or not a scaling
grid is shown and which auxiliary lines are given.
You can also use this page to define zone-
independent measurement sections. Please also
refer to the chapter: Scaling.
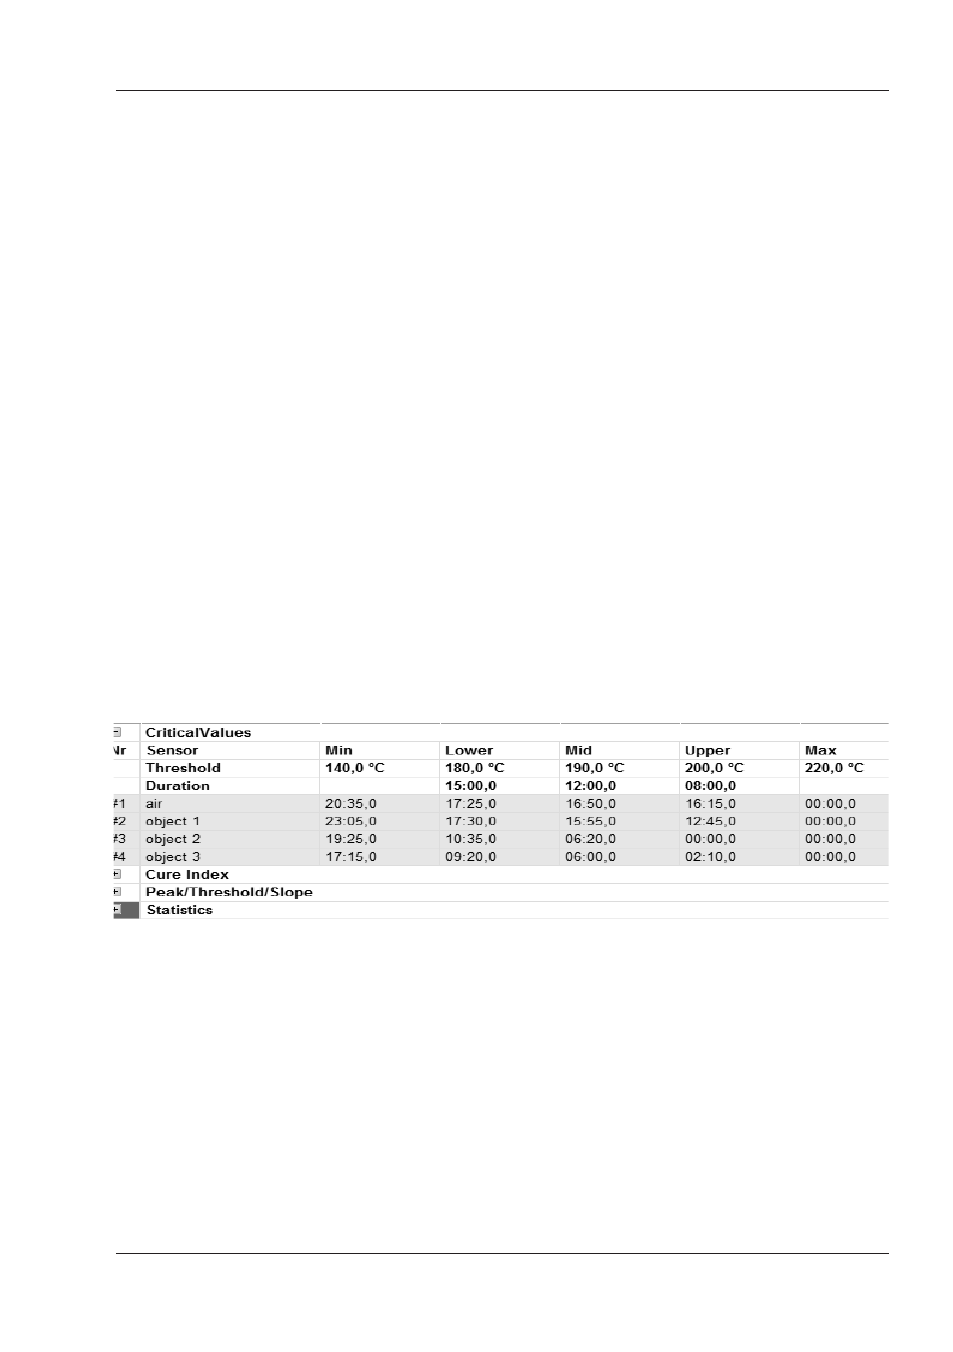
Immediately below the chart you will see the
Analysis pane (resize by dragging the divider line):
4.2.1.1 Scale Axes
The chart view normally shows the entire
measurement. If you want to look at a particular
detail or determine measurement sections
for analyzing purposes (e.g. an ascending or
descending branch for slope calculation) you have
two options:
Chart Area