ALTANA Temp-Chart User Manual
Page 23
22
Create a Cure Chart
2.5 Create a Cure Chart
Cure chart is a diagram of the duration time at
certain temperatures. So it is to be seen at a
glance whether the curing process lies within the
defaults of the paint manufacturer.
In the edit pane of the cure chart settings a curing
window is created according to the defaults of the
paint manufacturer. It can contain different ranges,
e.g. good, still OK, overcured.
The data is entered in a table and can also be
edited in the diagram window.
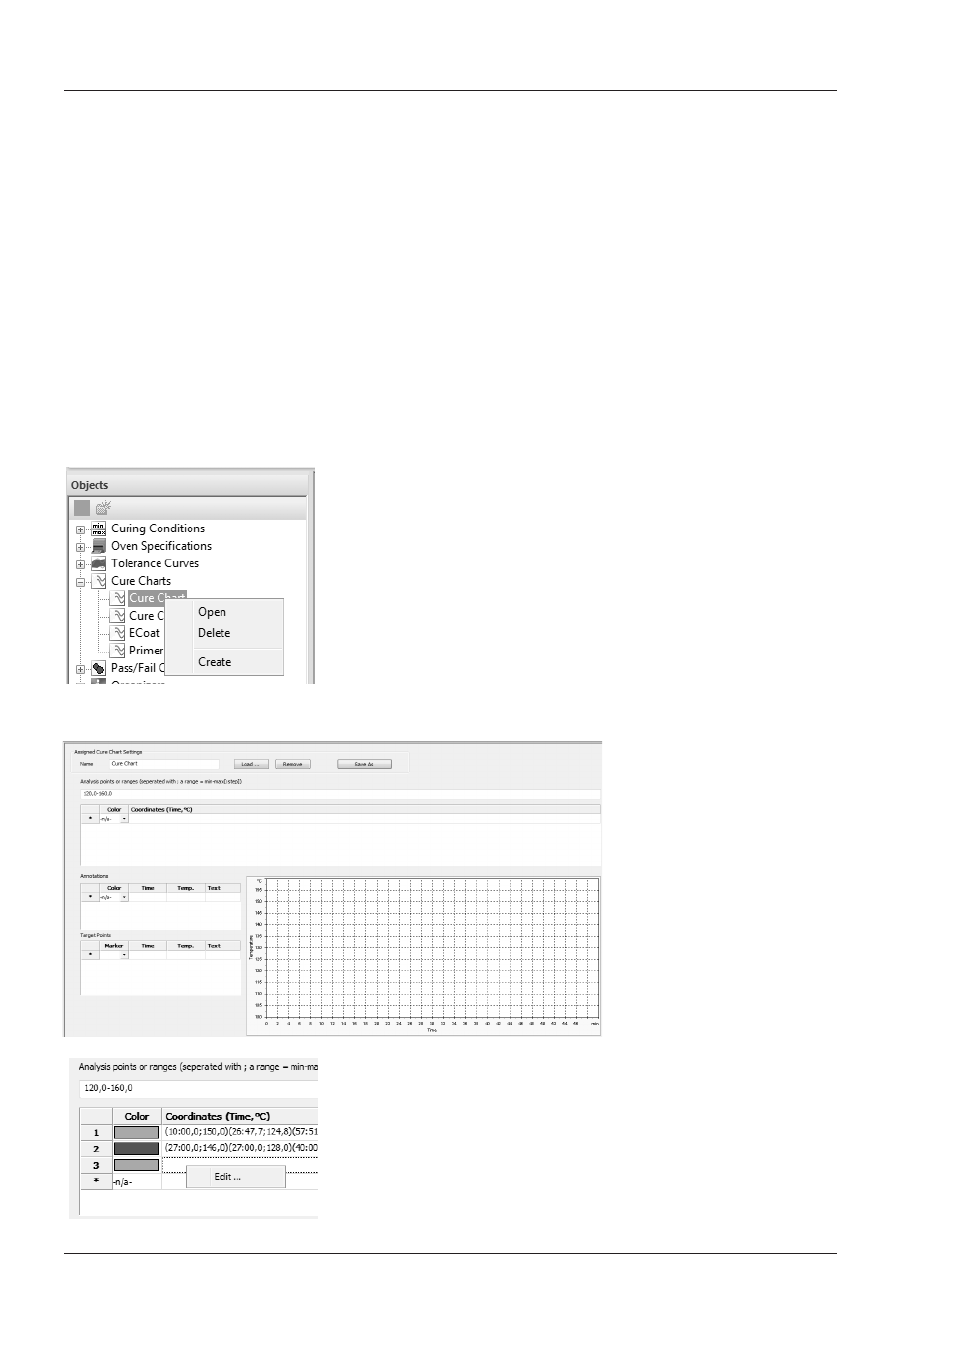
Right click on cure-chart from the Objects pane.
The selection windows opens. Select “Create“ to
create a new cure-chart.
The cure-chart window opens. Here you can enter
coordinates (time, temperature), annotations,
target points and analysis points or ranges.
Give the object a definite name and specify the
temperatures for the analysis. The pre-setting is
at 120 - 160 °C and must be adapted according to
the measuring range if necessary.
Afterwards you must select a color for the range.
With a left mouse click into an empty color field you
open the selection. select the color and confirm it
with another left mouse click.
To edit the area, right click into the correspondent
row and then left click onto the “Edit“-button.