Brookfield RST Rheometer User Manual
Page 41
Brookfield Engineering Labs., Inc.
page 41
Manual No. M14-223
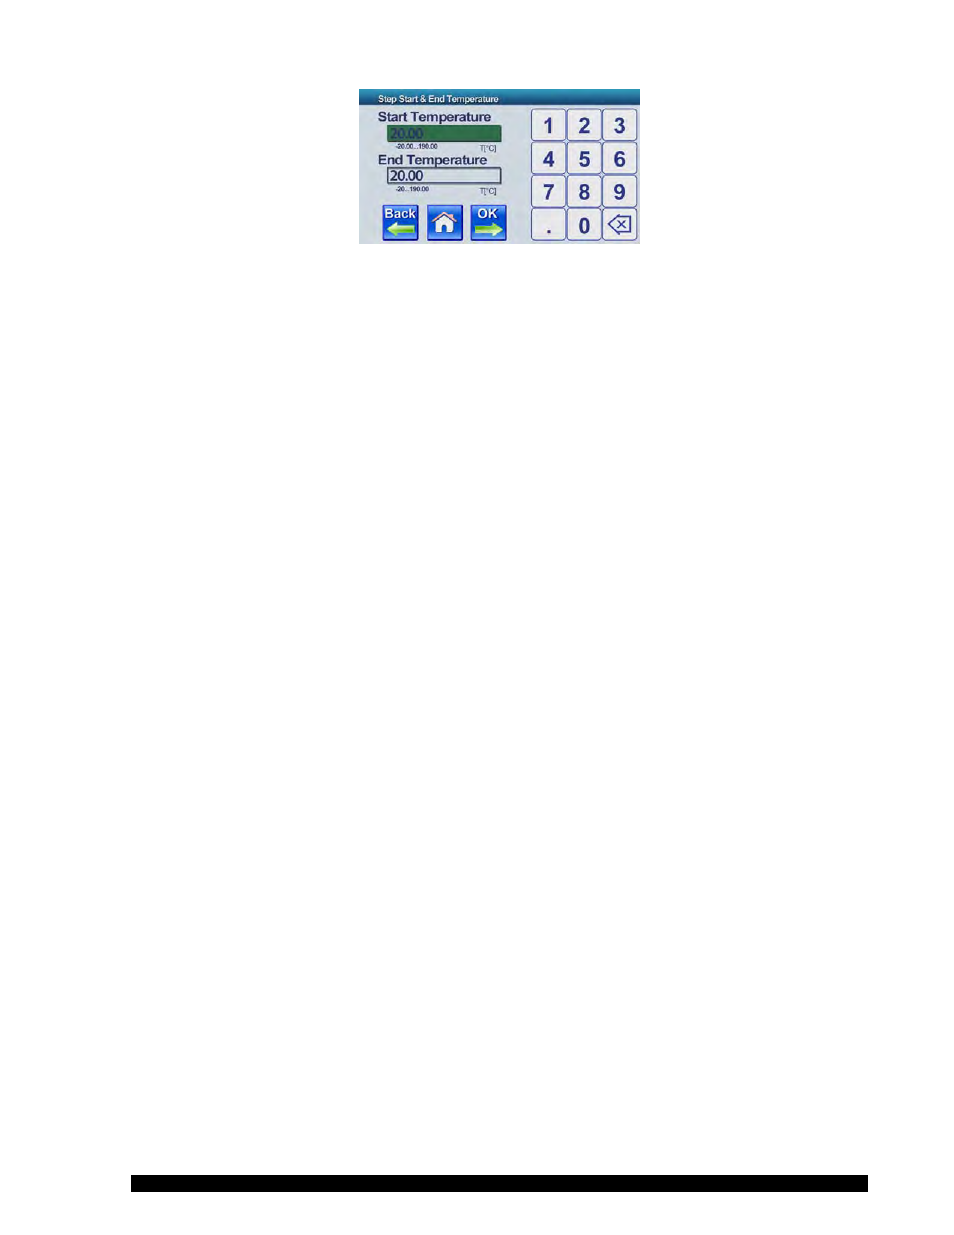
Figure III-45
While assembling your test blocks in the order needed to run your program, you may choose additional
functions if desired.
III.6.1 Quality Control
Drag the “QC” block to your test program. Double click on the QC block. The screen that appears allows
you to enter the target value for viscosity and the tolerance limits in ±% around the target value. For
example, if you enter 1000 cP and ±10%, the limits would be 900 cP to 1100 cP. Push OK.
The next screen allows you to control an alarm which is sounded by the RST Rheometer whenever the
viscosity is outside the QC limits that you set. The sliding scale allows you to set the amount of time that
the larm will beep for each measuring point that is outside the QC limits. The beep time can range from
0.1 seconds to 5 seconds. Your choice for beep time may depend on the time interval between
measuring points.
III.6.2 Math
Drag the “Math” block to your test program. Double click on the Math block. The screen that appears
allows you to create a summary data report which displays the minimum, maximum and average values
for shear rate, shear stress and viscosity. These values can be displayed for each step in the program
and/or for the overall test program.
III.6.3 Report
Drag the “Report” block to your test program. Double click on the Report block. A screen called “Default
Report Output” shows choices for data output:
• Output Group 1 gives you the choice to send the data to a USB-A memory stock or to a printer.
• Output Group 2 gives you the choice to send the data to a USB-B port or to a local area network,
such as Ethernet, or to an RS-232 serial port.
After selecting your data output, push OK to go to the next screen.
Choose the measuring points that you wish to include in your report by clicking the radio button that
satisfies your data requirement. If you check the “Math Model Result”, the report will include the minimum
viscosity value, the maximum viscosity value and the average viscosity value.
Push OK to go to the next screen: