Brookfield RST Rheometer User Manual
Page 28
Brookfield Engineering Labs., Inc.
page 28
Manual No. M14-223
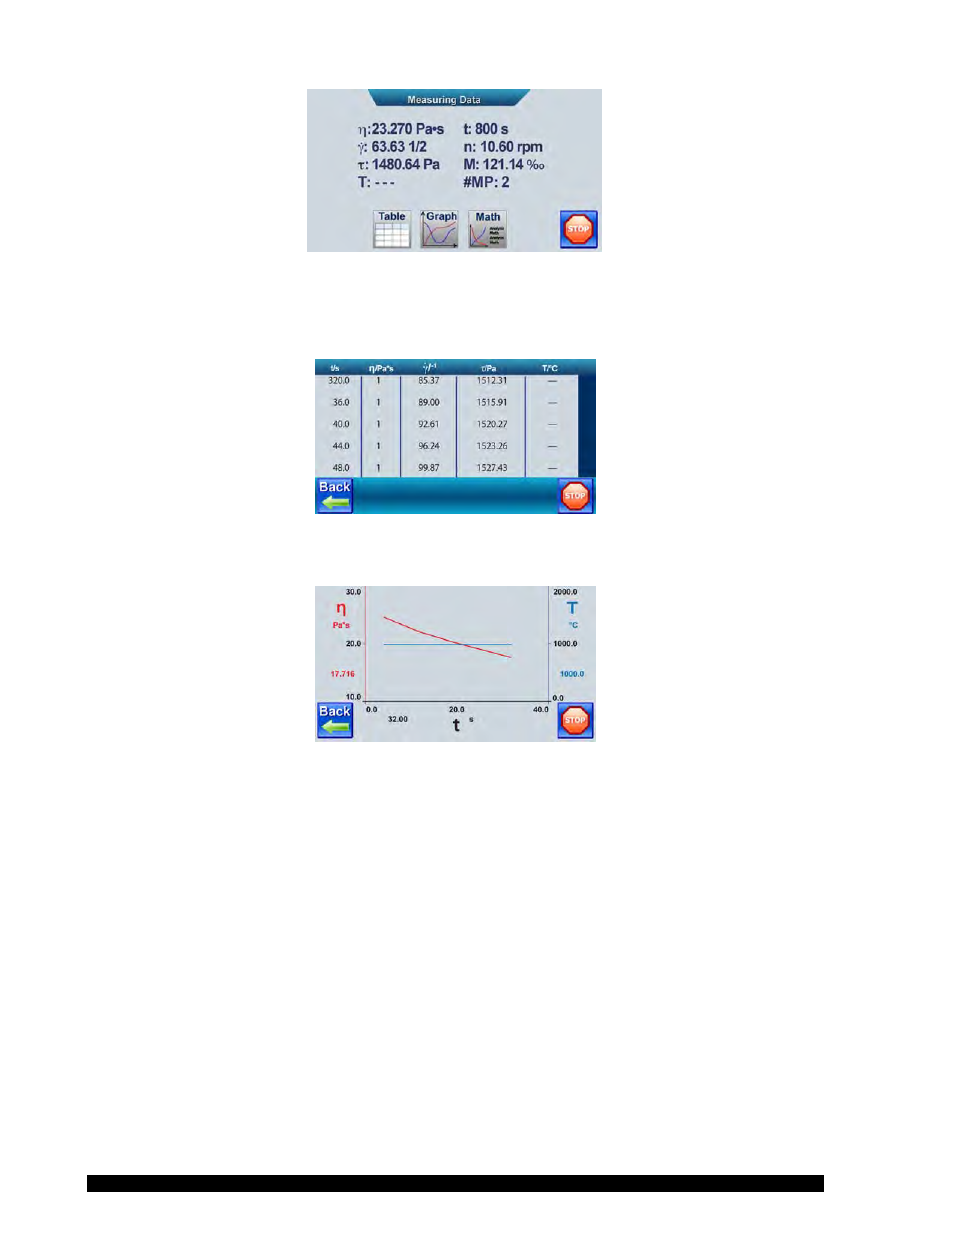
Figure III-12
While the test is running, the following choices are available for data display format:
a) Table format with values for time, viscosity, shear rate or speed, shear stress or torque, and
temperature.
Figure III-13
b) Graph format with time on the x-axis, viscosity on the y-1 axis, and temperature on the y-2 axis.
Figure III-14
c) Math format which shows the minimum viscosity value, the maximum viscosity value and the average
of all viscosity values. The top half of this table contains data while the bottom half remains empty
because there is only one block in this test with multiple steps. See Program Tests to understand how the
bottom half of this table is used.
If the STOP button is pushed at any time, the test will stop, and the measuring point data will be saved up
to that time.
13. At the end of the test, the operator has the following choices:
a) Repeat the test by pushing the CIRCULAR ARROW. This allows you to repeat the same test by using
a single button push.
b) Go to the Data File by pushing the FOLDER BUTTON. This allows you to review data for the test that
has just completed. This is discussed in the next Section.
c) Push OK to return to the main screen.
14. Click on the FOLDER icon. The parameters for the completed test are reviewed on the next two
screens. The first screen will review the company/user information if the USER MANAGEMENT feature