Events panel, Statistics panel – Dell UPS 4200R User Manual
Page 49

Supervision
50
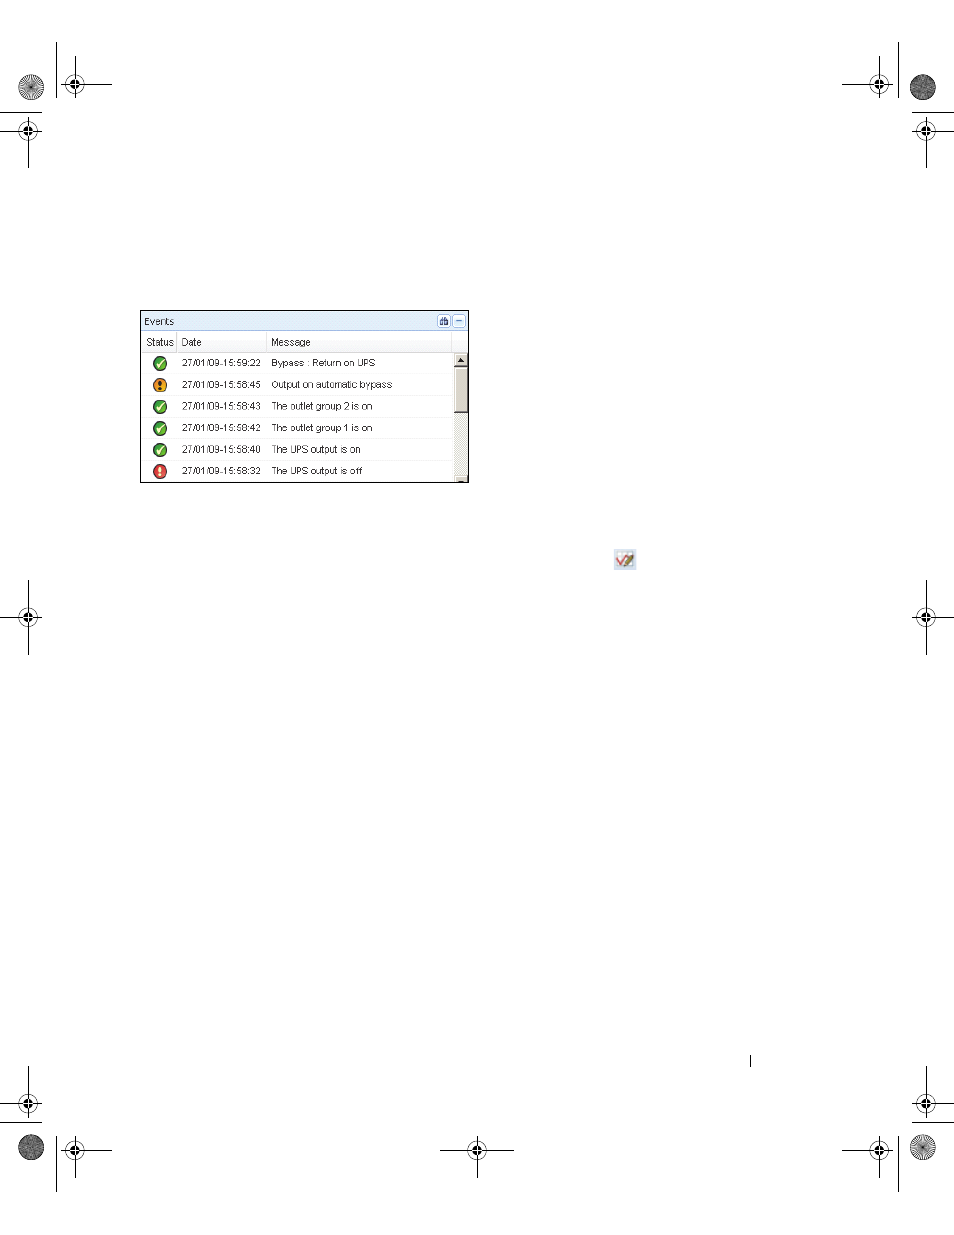
Events Panel
This panel displays the events list of the selected node (see Figure 30). You can sort the events according
to status, date, and message by clicking the column header.
Figure 30. Events Panel
Statistics Panel
This panel displays the statistics of the selected node (see Figure 31). The
button allows you to select
the time interval for the statistics. You can adjust the time interval by clicking the two buttons with the
“From” and “To” dates.
The statistics computed data is as follows:
• Apparent Consumption (or Active Consumption in next release, in Watts)
• Average Apparent Power (or Average Active Power in next release, in Watts)
• Power Failure Count
• Power Failure Cumulated Duration
• Battery Fault Count
• Internal Failure Count
• Overload Count
• Warning Alarm Count
• Critical Alarm Count
• Output Off Count
• Communication Lost Count
NOTE:
This information depends on device capabilities.
0119_2-Dell MUMC UG.book Page 50 Saturday, November 2, 2013 4:59 PM
