Standard curve, Report – Bio-Rad Gel Doc™ EZ System User Manual
Page 68
Criterion Stain Free
TM
System | Viewing Results
54
Standard Curve
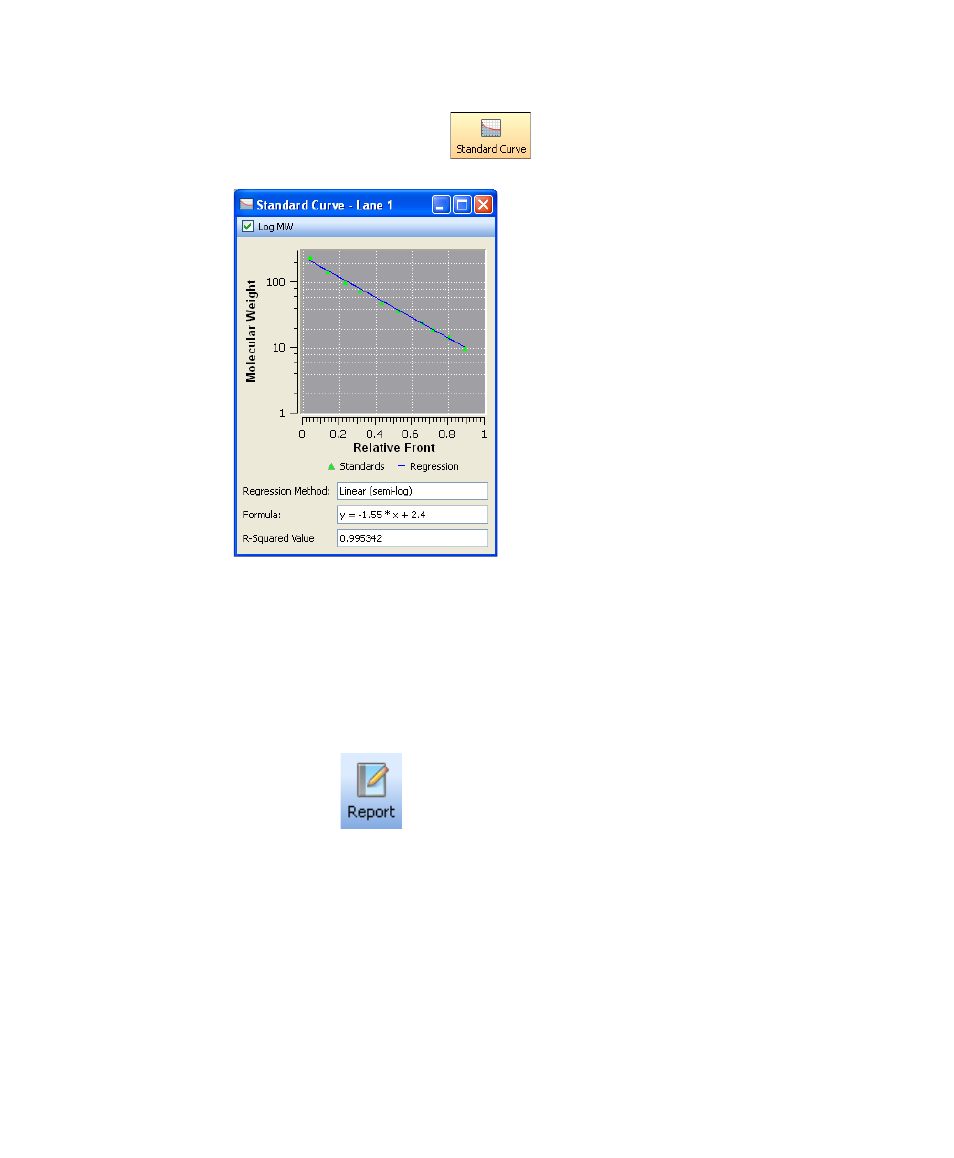
This dialog displays the best fit curve for your defined standards and the
bands relative to this curve, for the lane you have selected in the image.
Standards are displayed in green, and unknown bands are in red. You can
change the molecular weight display on the Y axis between linear and log
scale, by clicking the Log MW box at the upper left. The regression method
you have chosen in Molecular Weight Analysis Tools is displayed, as well as
the line formula (if applicable) and R-squared value for that lane’s data.
Report
See Chapter 8 “Generating Reports” on page 65 to learn about all the choices
you have when deciding what to include in your report.
This manual is related to the following products: