Displaying results data, Analysis table options, Set window size – Bio-Rad Gel Doc™ EZ System User Manual
Page 64
Criterion Stain Free
TM
System | Viewing Results
50
Displaying Results Data
Results data associated with the gel images can be visualized several different
ways; as an Analysis Table, a Lane Profile, a Standard Curve, or in a Report.
Buttons to toggle these views on and off are located in the main toolbar. All of
them can be viewed at one time. Each are described below.
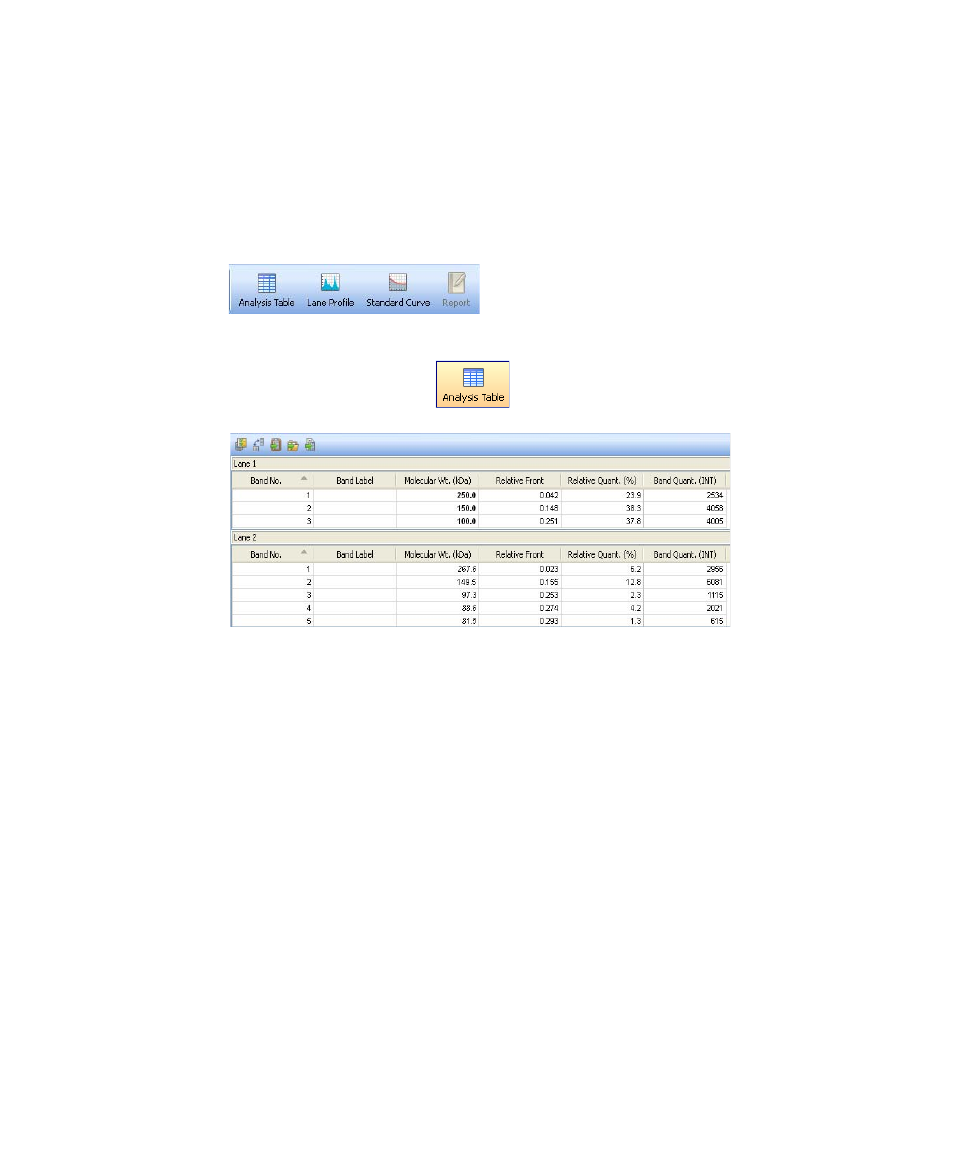
Analysis Table
Options
Clicking on the Analysis Table button opens a tabular display of the data
extracted from the Results File. The icons above the table offer several ways
of displaying and exporting Analysis Table data.
S
ET
W
INDOW
S
IZE
To change the size of your Analysis Table window, move your mouse to the
top of the window until the cursor changes into a double-headed arrow. Left-
click and drag the edge of the window until you can see all of your data.
NOTE: Resizing the Analysis Table window is restricted while a
Protocol window is open.