Analyze image, Step 3. detect lanes and bands, Low band detection sensitivity – Bio-Rad Gel Doc™ EZ System User Manual
Page 51: High band detection sensitivity, Custom
Creating and Running Custom Protocols
37
Analyze Image
S
TEP
3. D
ETECT
L
ANES
A
ND
B
ANDS
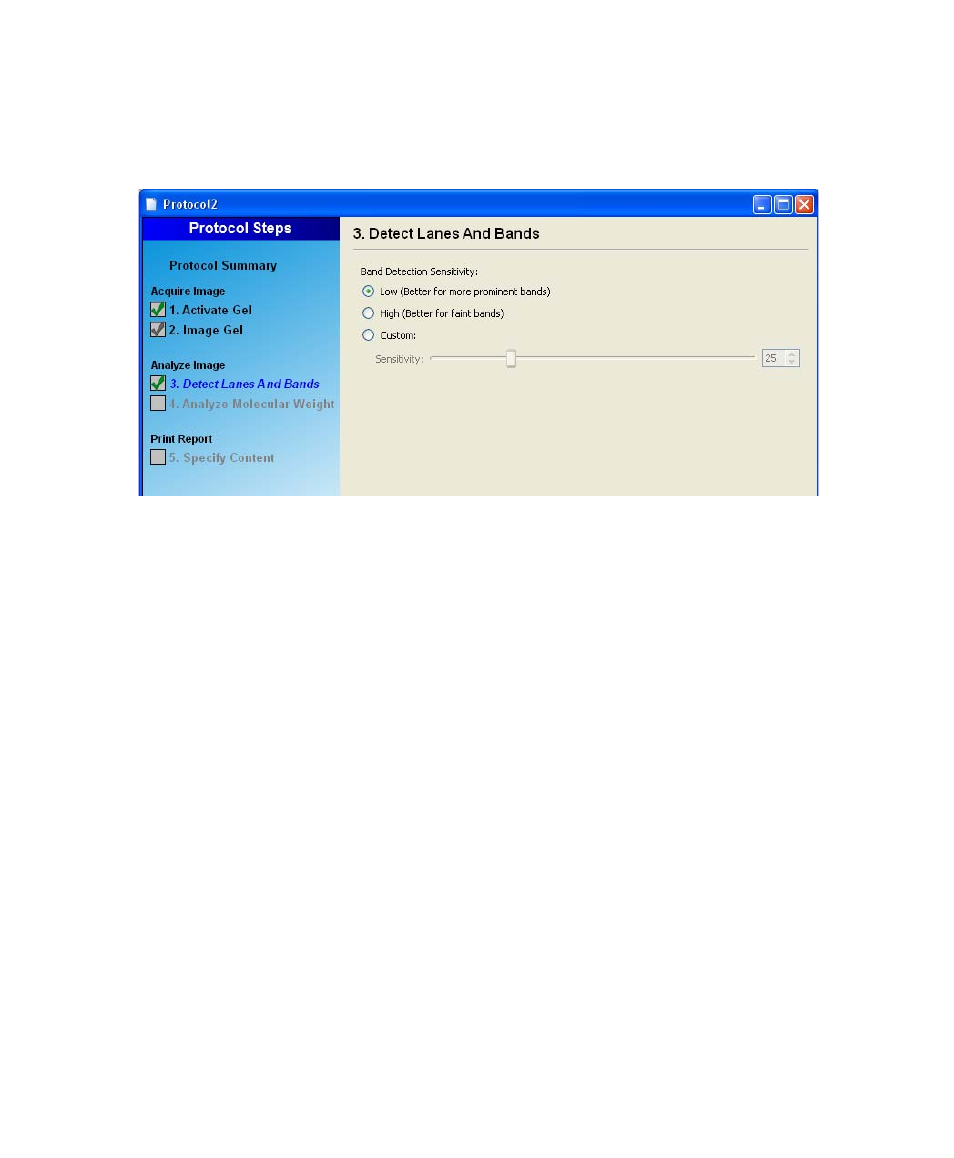
To perform any analysis on the gel, Image Lab needs to detect lanes and
bands on the gel image. The lanes are detected automatically.
You have the following choices to customize band detection:
L
OW
B
AND
D
ETECTION
S
ENSITIVITY
This setting will set detection at a low level, for images with more prominent
bands. Faint bands will not be detected with this setting.
H
IGH
B
AND
D
ETECTION
S
ENSITIVITY
This setting will set detection at a higher level, for images that are more faint.
Extraneous bands can be removed later, using the Band Tools in the Analysis
Tool Box. See “3. Band Tools” on page 60.
C
USTOM
You can set a numerical value between 1-100, in order to select the best
detection sensitivity for your sample.
NOTE: When Low or High Band Detection Sensitivity is used,
these are the numerical values that are set:
Low sensitivity = 25
High sensitivity = 75