Stats screen – Bird Technologies 3129 Display User Manual
Page 46
30
Figure 15 Alarm Active Message
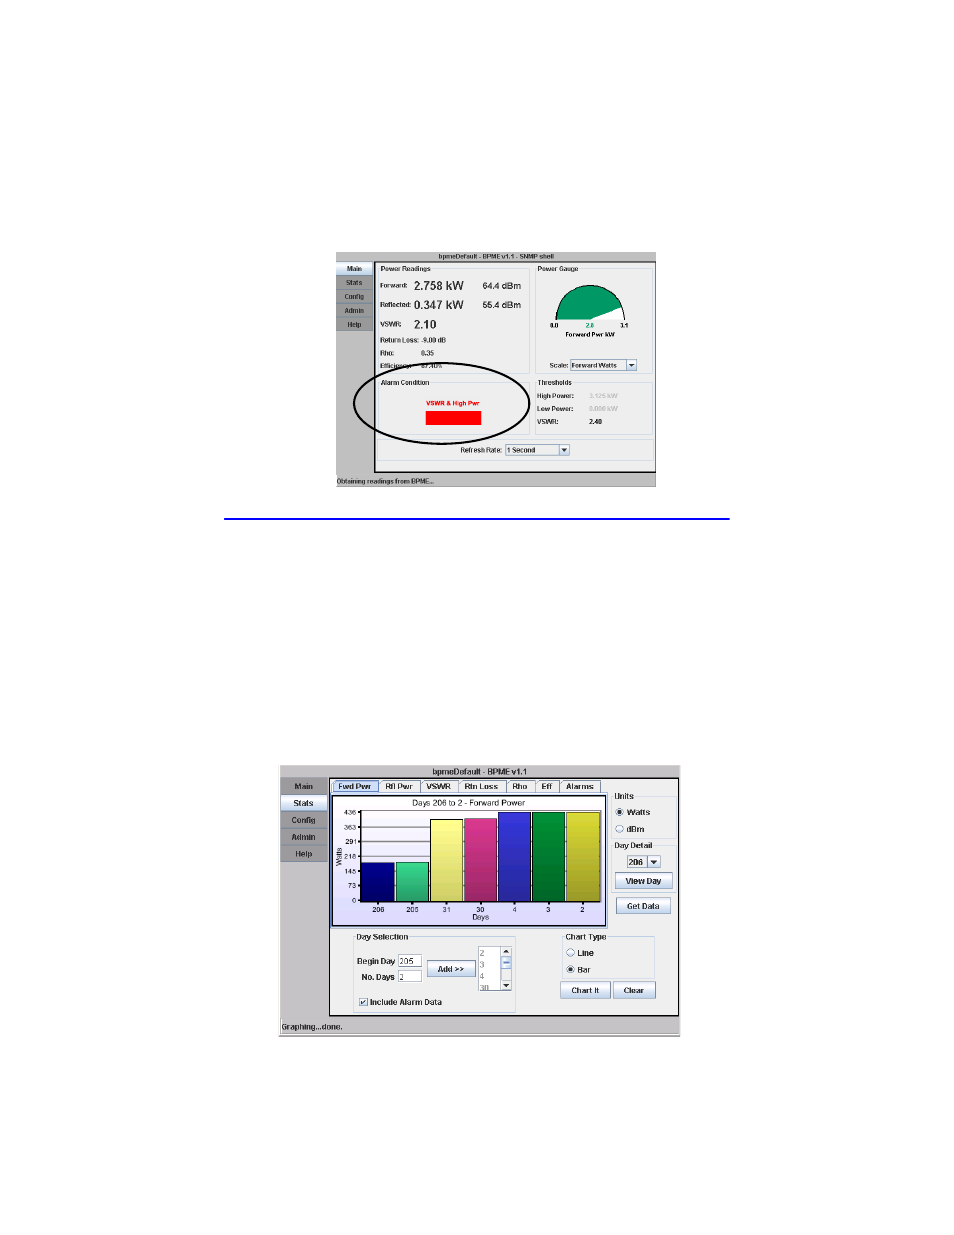
Stats Screen
The Stats screen (Figure 16 on page 30) can chart and display historical data
stored in the BPM-E memory. You can chart forward and reflected power read-
ings and alarm conditions (low power, high power, and VSWR alarm). You can
display the data in either a line graph or a bar chart.
The BPM-E keeps data for a 365 day period. You select the starting day (in the
Begin field) and the number of days to view. Day 0 is today, day 1 is yesterday,
and so on to day 364. Click the Add >> button to add the days to the list to view.
When you click the Chart It button, the WebTool retrieves the data and gener-
ates a new chart. Click the Clear button to clear your day selection.
For more information about the Stats screen features, refer to the help section
in the software (click on the Help button).
Figure 16 Web Tool Stats Screen
Reset Alarm