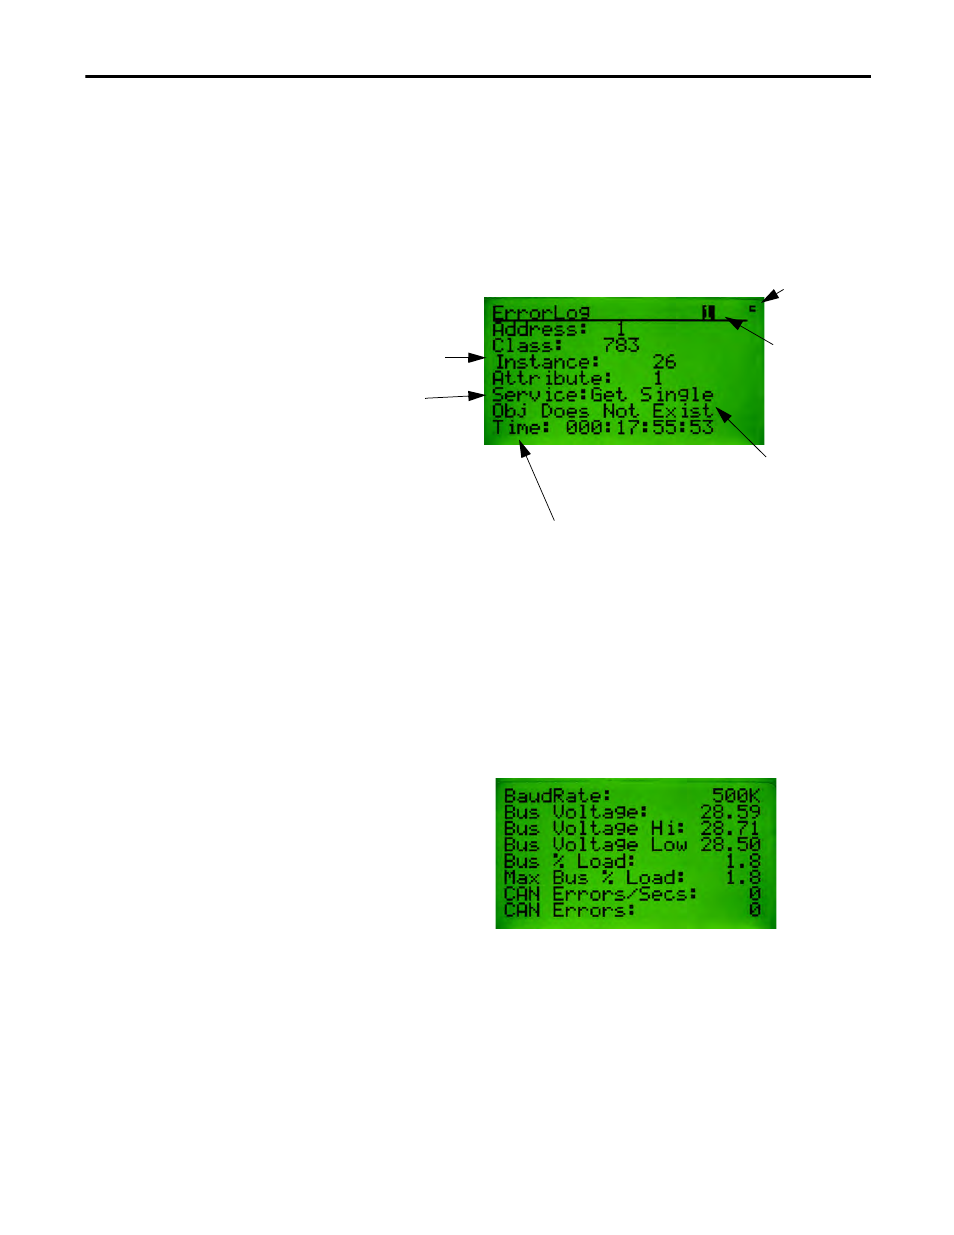
Devicenet™ error log, Network statistics screen, Devicenet™ error log network statistics screen – Rockwell Automation 193-DNCT DeviceNet Configuration Terminal User Manual User Manual
Page 71

Rockwell Automation Publication 193-UM009B-EN-P - February 2013
67
Terminal Choices Menu Chapter 16
DeviceNet™ Error Log
The DeviceNet™ Error Log stores the last five errors the Configuration Terminal
received when requesting information from a device. If the terminal receives an
error that is the same as the last error, only the first error will be stored. Errors
received while in the Who Menu are not entered into the error log. Each error has
a time stamp associated with it that indicates the number of days, hours, minutes,
and seconds since the error message was received. The Error Log screen has the
following format:
Network Statistics Screen
This screen displays some DeviceNet™ network statistics such as baud rate, actual
bus voltage stats, percentage of bus loading stats, CAN errors per second, and
total CAN errors. Latching of statistics for some readings begins when the screen
is entered, and stops when exiting the screen. Statistics can be cleared by exiting
and re-entering the menu. While displaying this screen, the 193-DNCT will not
respond to any DeviceNet™ messages directed to it. There will be a short delay
when exiting this screen before the Terminal starts producing DeviceNet™
messages, due to the CAN chip being reset and re-initialized. The Network Stats
Menu has the following format:
This menu
supports the
CIA Copy
function
Error Buffer
Number, use the
Inc/Dec keys to
scroll through
each entry in the
log.
Node Number,
Class, Instance,
and Attribute of
request for which
an error was
returned
Requested Service:
Get Single
Set Single
Get All
Set All
Reset
Create
Delete
The Error
code that
was returned
Time Stamp:
DDD:HH:MM:SS
D = Days
H = Hours
M= Minutes
S = Second
