AiM MyChron3 XG Log User Manual
Page 82
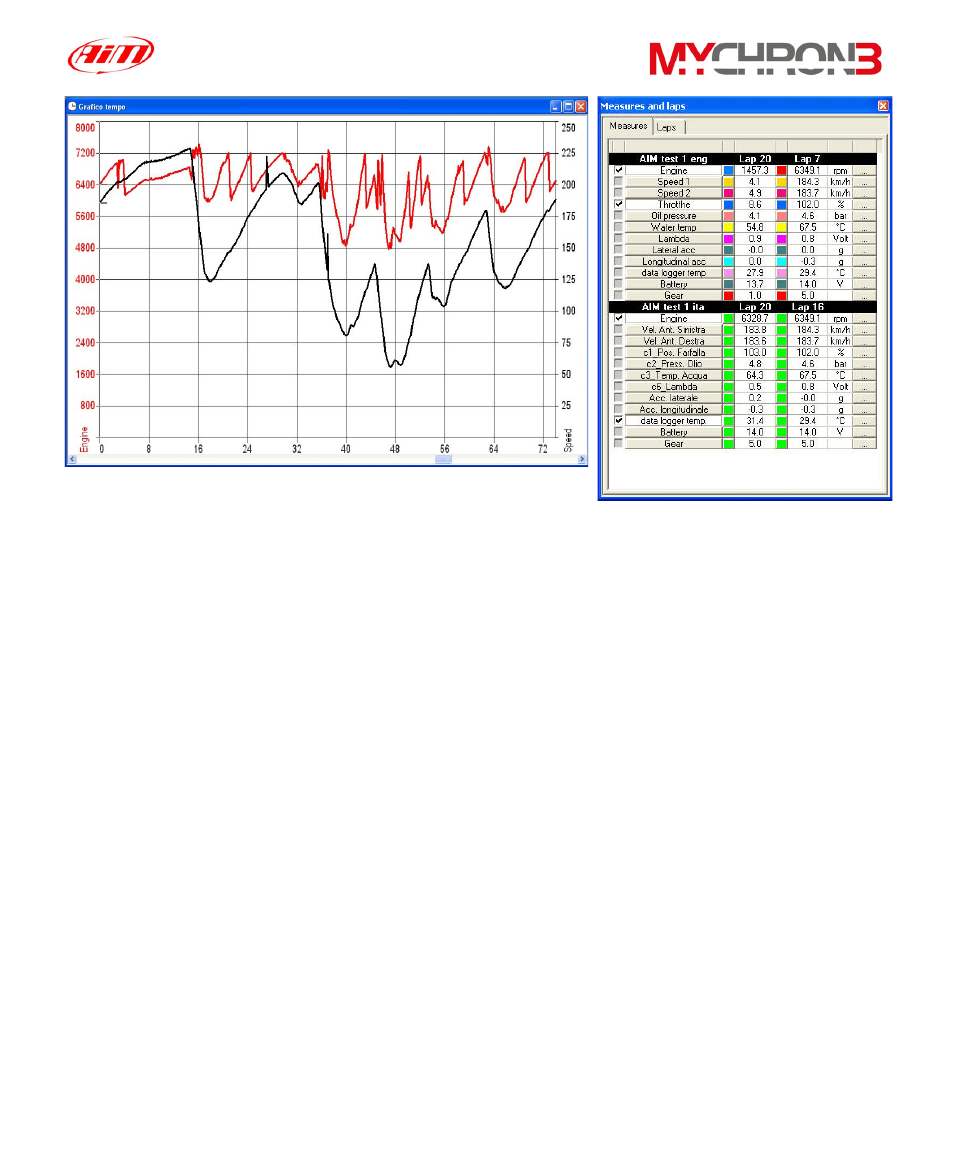
Left click on the coloured-boxes column if you wish to change the graph colour:
the user may set the desired colour for each recorded lap and for each sampled
channel. If you wish to add the scale to the graph, left click in the checkbox
corresponding to the desired channel name.
Left click on the pushbuttons of the last column of the “Measures and laps”
toolbar to load the “Measure information” dialog box: this window allows the user
to change the channel name, the plotting scale and the unit of measure.
It is also possible to amplify and shift the diagram by using the
“Value=(Value*A)+B” option: A is the amplification factor (included between -1000
and +1000), while B is the shift factor (included between –500000 and +500000).
In the following picture it is reported the “Measure information” dialog box.
82