2 audio output typical performance plots, Cs35l32 – Cirrus Logic CS35L32 User Manual
Page 46
46
DS963F4
CS35L32
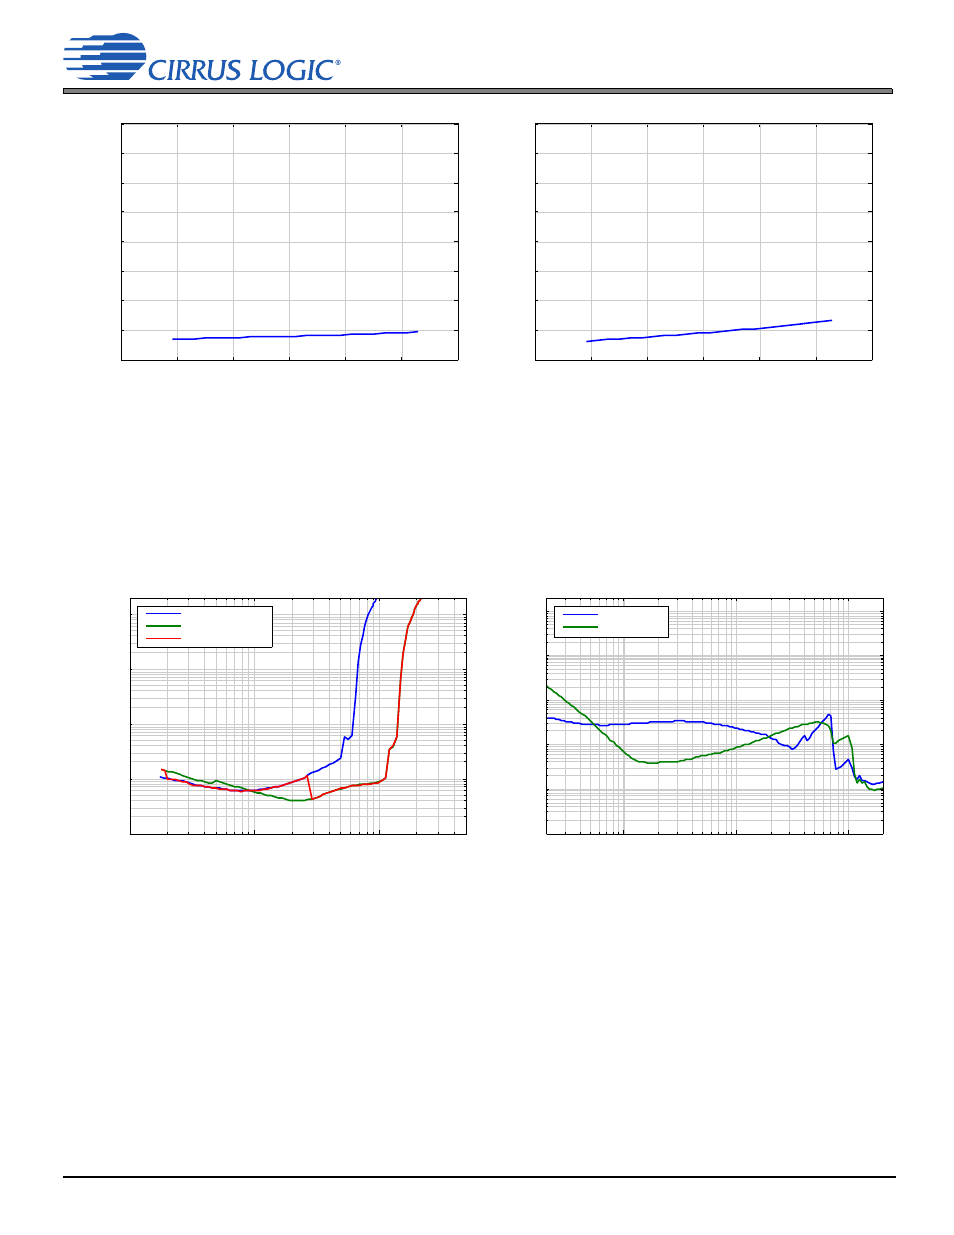
8.2 Audio Output Typical Performance Plots
8.2 Audio Output Typical Performance Plots
To avoid nonlinearities (distortion) introduced by the amplifier load inductor itself, all amplifier typical performance plots
use a resistor and not a simulated speaker load. No EMI filtering is populated on the amplifier outputs (OUT±).
Figure 8-5. Device Idle Power Consumption, Current vs. VP—
VBST = 5.0 V, VBST = VP = 3.6 V
Figure 8-6. Device Idle Power Consumption, Power vs. VP—
VBST = 5.0 V, VBST = VP = 3.6 V
Figure 8-7. THD+N Ratio vs. Output Power @ 1 kHz, 8
—
Bypass Mode (VBST = VP = 3.6 V),
Fixed Boost Mode (VBST = 5 V), Automatic Mode
Figure 8-8. THD+N Ratio vs. Frequency, 8
—
Bypass Mode (VBST = VP = 3.6 V, Load = 0.5 W),
Fixed Boost Mode (VBST = 5 V, Load = 1 W)
2.5
3
3.5
4
4.5
5
5.5
0
5
10
15
20
25
30
35
40
VP Voltage (V)
VP Idle Current (mA)
2.5
3
3.5
4
4.5
5
5.5
0
20
40
60
80
100
120
140
160
VP Voltage (V)
VP Idle Power (mW)
VBST = VP
VBST = 5 V
Automatic Mode
0.01
0.1
1
0.001
0.01
0.1
1
10
Output Power (W)
THD+N Ratio (%)
VBST = VP
VBST = 5 V
100
1000
10000
0.0001
0.001
0.01
0.1
1
10
Frequency (Hz)
THD+N Ratio (%)