8 typical performance plots, Typical performance plots, Cs35l32 – Cirrus Logic CS35L32 User Manual
Page 45
DS963F4
45
CS35L32
8 Typical Performance Plots
8 Typical Performance Plots
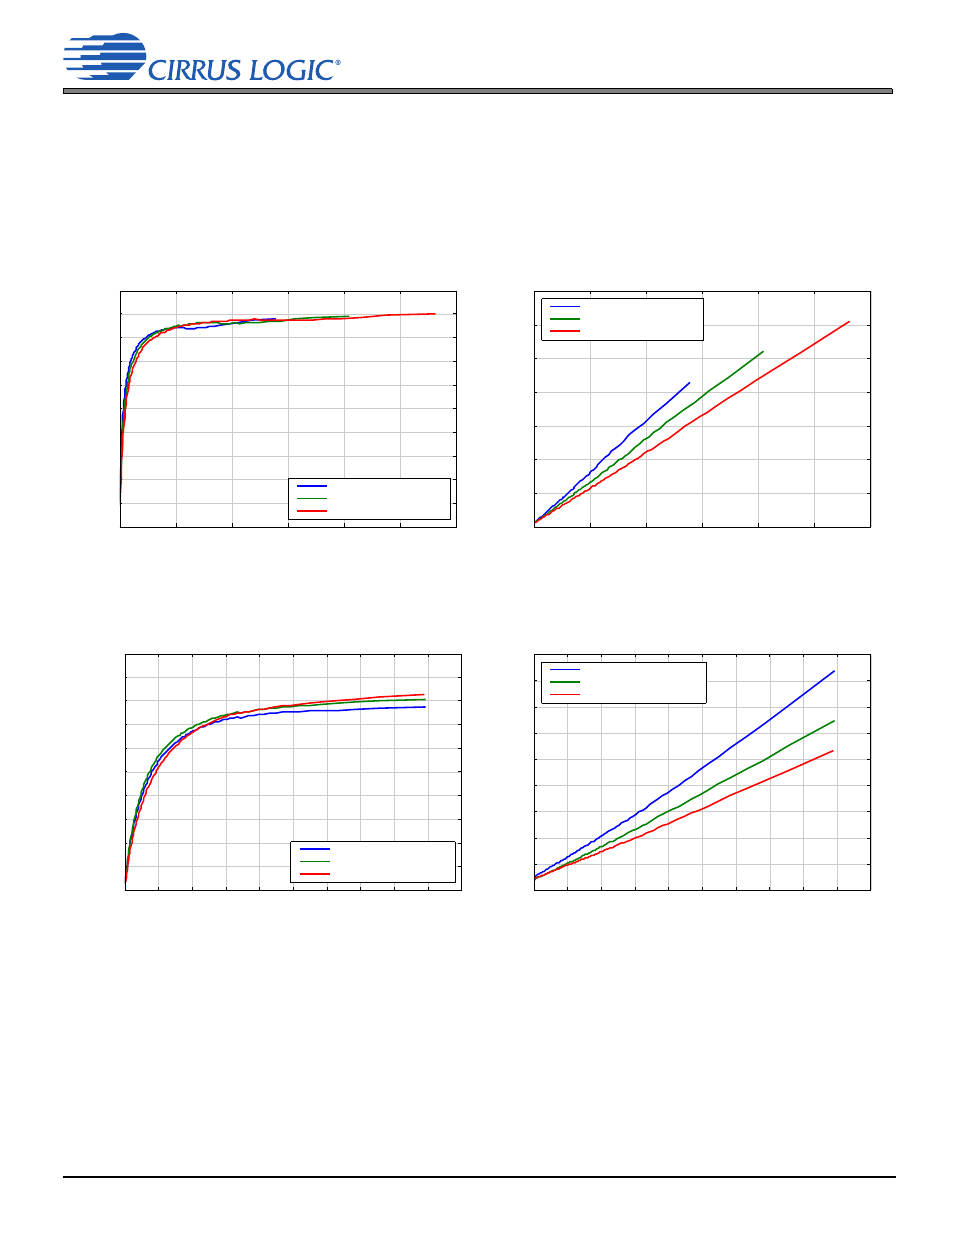
8.1 System-Level Efficiency and Power-Consumption Plots
For all system-level efficiency and power-consumption plots, a simulated speaker load (8
+ 33 H) is used; the amplifier
PWM outputs (OUT±) contain no EMI filtering. Efficiency calculations are based on RMS power delivered to the load at
the generated frequency and include power consumption of both VA and VP.
Figure 8-1. Efficiency vs. Output Power—VBST = VP
(VP = 3.0 V, VP = 3.6 V, VP = 4.2 V)
Figure 8-2. VP Supply Current vs. Output Power—VBST = VP
(VP = 3.0 V, VP = 3.6 V, VP = 4.2 V)
Figure 8-3. Efficiency vs. Output Power—VBST = 5.0 V
(VP = 3.0 V, VP = 3.6 V, VP = 4.2 V)
Figure 8-4. VP Supply Current vs. Output Power—VBST = 5.0 V
(VP = 3.0 V, VP = 3.6 V, VP = 4.2 V)
VBST = VP, VP = 3.0 V
VBST = VP, VP = 3.6 V
VBST = VP, VP = 4.2 V
0
200
400
600
800
1000
1200
0
10
20
30
40
50
60
70
80
90
100
Output Power (mW)
Efficiency (%)
VBST = VP, VP = 3.0 V
VBST = VP, VP = 3.6 V
VBST = VP, VP = 4.2 V
0
200
400
600
800
1000
1200
0
50
100
150
200
250
300
350
Output Power (mW)
VP Current (mA)
VBST = 5 V, VP = 3.0 V
VBST = 5 V, VP = 3.6 V
VBST = 5 V, VP = 4.2 V
0
200 400 600 800 1000 1200 1400 1600 1800 2000
0
10
20
30
40
50
60
70
80
90
100
Output Power (mW)
Efficiency (%)
VBST = 5 V, VP = 3.0 V
VBST = 5 V, VP = 3.6 V
VBST = 5 V, VP = 4.2 V
0
200 400 600 800 1000 1200 1400 1600 1800 2000
0
100
200
300
400
500
600
700
800
900
Output Power (mW)
VP Current (mA)