11 system adjustments, 1 frequency range, 12 system validation – Campbell Scientific CDM-VW300 Series Dynamic Vibrating-Wire Analyzer System User Manual
Page 59: 1 sensor validation, 2 monitoring system performance, System adjustments, Frequency range, System validation, Sensor validation, Monitoring system performance
CDM-VW300 Series Dynamic Vibrating-Wire Analyzers
7.11 System Adjustments
7.11.1 Frequency Range
Assuming a reasonable level of certainty about the maximum and minimum
frequency response of a sensor (that is, what frequency values are returned
when the sensor experiences maximum and minimum phenomena or stimulus
conditions), the minimum and maximum frequency settings (LowFreq and
HighFreq in CRBasic CDM_VW300Config() instruction) can be used to
implement further noise reduction of the sensor response. For example, at 100
Hz, the CDM-VW300 is capable of measuring frequencies between 580 and
6000 Hz. However, if a sensor frequency will always fall between 2000 and
3000 Hz, even for the lowest or highest reasonable readings, the minimum
frequency (LowFreq) can be set to 2000 Hz, and the maximum frequency
(HighFreq) set to 3000 Hz. The result will be that unwanted signals, such as
noise, between 580 and 2000 Hz, and between 3000 and 6000 Hz will be
filtered out.
7.12 System Validation
7.12.1 Sensor Validation
Confirm sensors are working with the CDM-VW300 by using a USB
connection with DevConfig or DVWTool software. Status-indicating LED
lights are provided for each sensor channel — two on the CDM-VW300 and
eight on the CDM-VW305. TABLE 7-5 lists meanings of these indicators.
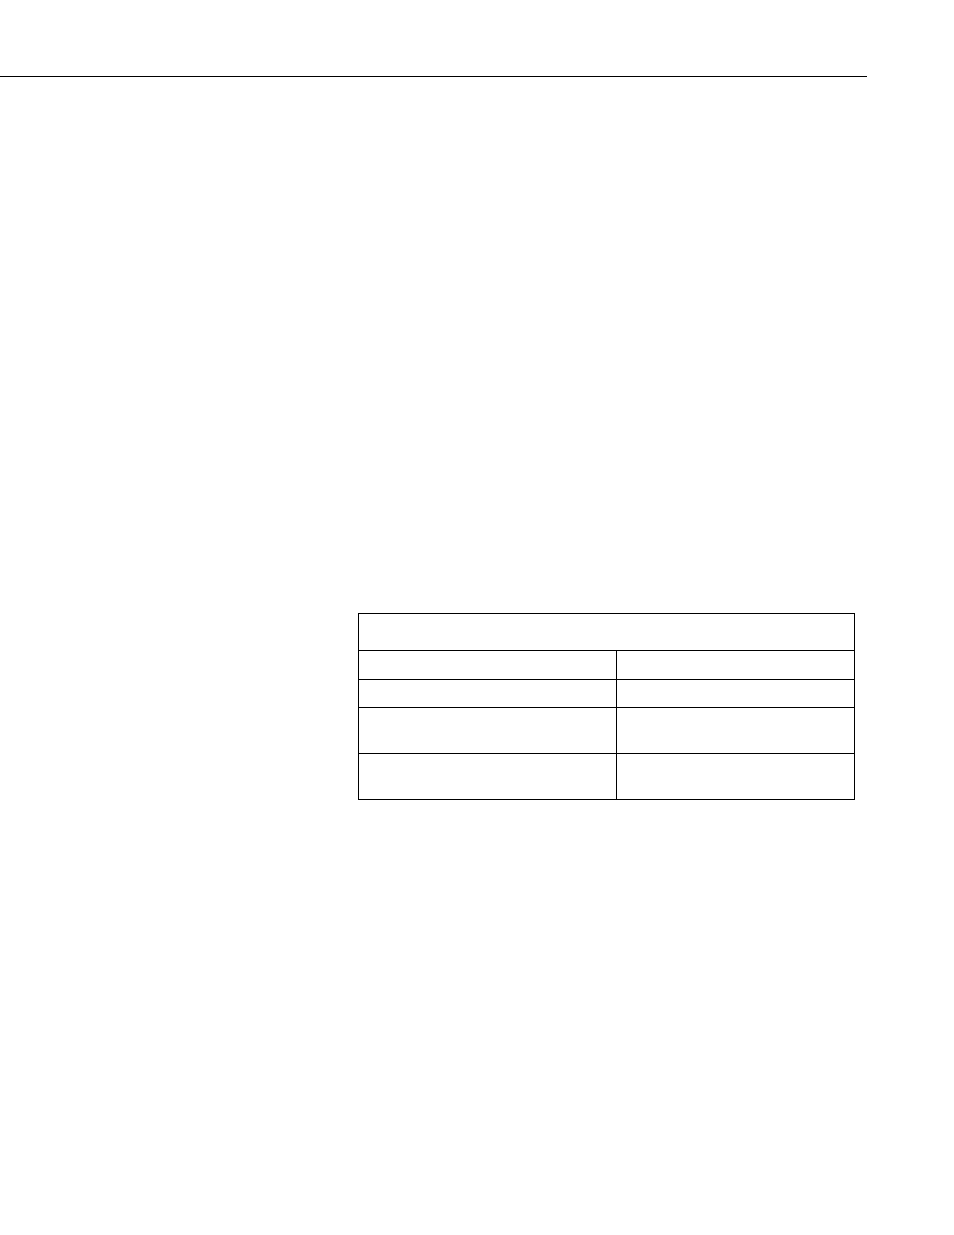
TABLE 7-5. CDM-VW300 Channel-Status LED States
Flash green or red at 3 s interval
Channel set to actively measure.
Flash green
Response received from sensor.
Flash red
Diagnostic flags indicate there may
be a problem.
No flash, unlit
Channel not designated as active
for measurement.
For more detail on how to activate individual channels for measurement, see
Section 7.1.2, Using DVWTool or Section 7.1.3, Using DevConfig.
7.12.2 Monitoring System Performance
RTDAQ or LoggerNet software is typically used to monitor system
performance. For complete information about using these software, consult the
associated Help or respective manuals, which are available at
.
To use the tools for datalogger monitoring provided in RTDAQ or LoggerNet,
start the software and open a numeric display of the Public table (LoggerNet:
Num Display, RTDAQ: Monitor Data tab). In the Public
table, observe the
frequencies or readings that correspond to the analyzer channels selected for
measurement. FIGURE 7-16 and FIGURE 7-17 shows a data displays in
LoggerNet and RTDAQ.
49