5 zero/span flow, Zero/span flow, 1. irga settings – Campbell Scientific AP200 CO2/H2O Atmospheric Profile System User Manual
Page 64: 2. irga outputs
AP200 CO
2
/H
2
O Atmospheric Profile System
message_log output table when the configuration command is sent and when
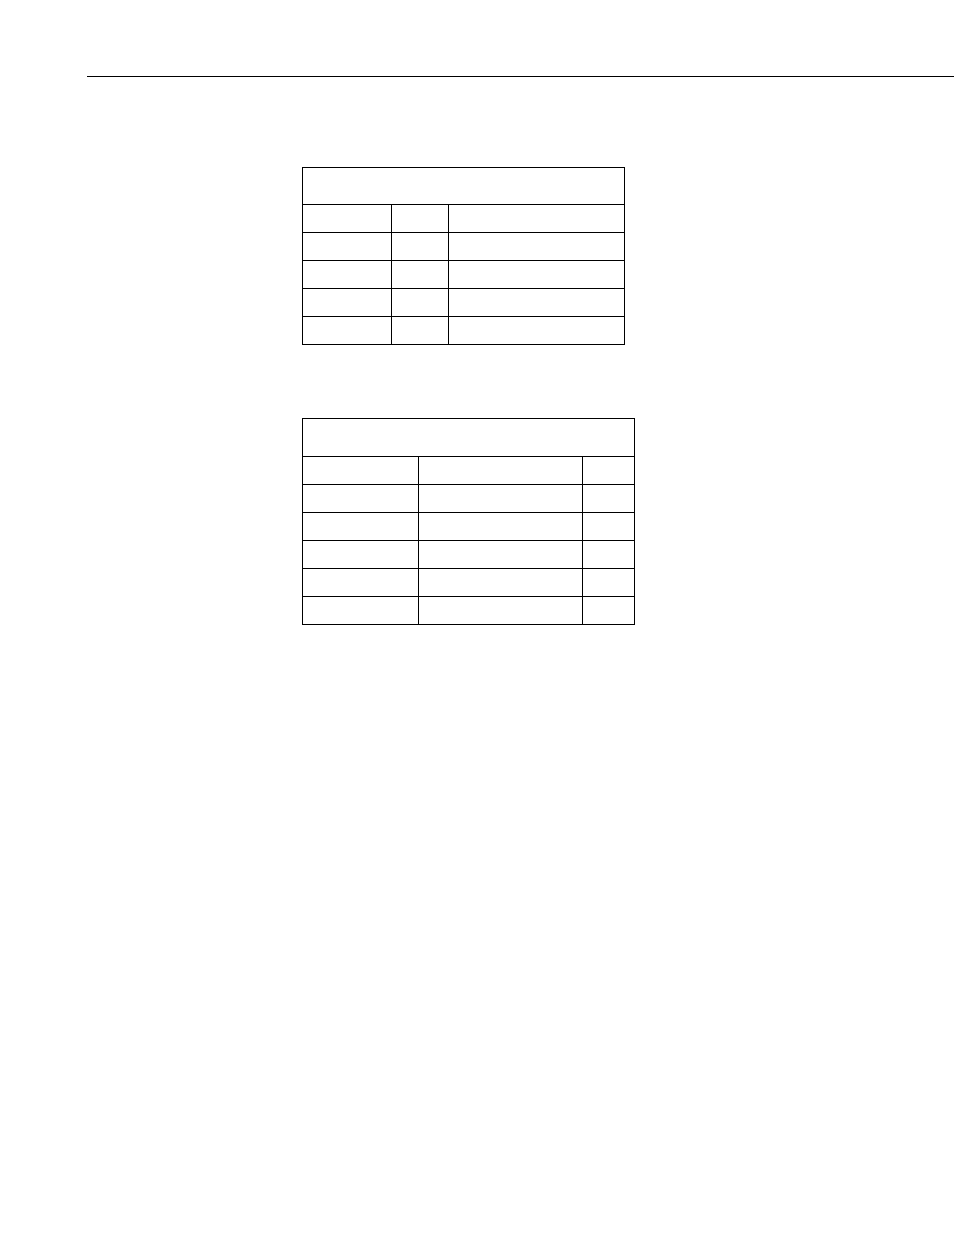
the settings are acknowledged. The IRGA settings are given in TABLE 7-1.
TABLE 7-1. IRGA Settings
Setting
Value Notes
OUTRATE 0.5
Output data every 0.5 s
HEATER
TRUE Turn heater on
PCOMP
TRUE Pressure compensation on
FILTER
0
No filter
The outputs from the IRGA are shown in TABLE 7-2 and include:
TABLE 7-2. IRGA Outputs
Public variable Description
Units
CO
2
CO
2
concentration
ppm
H
2
O
H
2
O concentration
ppt
cell_tmpr
Sample cell temperature °C
cell_press
Sample cell pressure
kPa
Td_cell
H
2
O dewpoint
°C
7.5 Zero/Span Flow
The flow for the zero and CO
2
span cylinders is affected by the pressure
regulator performance. Pressure regulators designed for a low delivery
pressure will generally perform better and should be used where possible. To
adjust these regulators, start with them set for 0-psig outlet pressure. Select the
corresponding inlet and observe the sample flow. Adjust the regulator outlet
pressure to give approximately the same sample flow as for the profile inlets
(within 10%).
Most pressure regulators will regulate the pressure only when there is flow
through them. When the flow stops (because the AP200 selects some other
valve), the pressure will rise above the setting. It will remain high until the
zero or CO
2
span valve is again selected, and the flow can resume. The flow
will be higher than normal (because pressure is higher than normal) until the
excess pressure is bled from the regulator and tube.
Most pressure regulators will also be affected by ambient temperature. If the
zero or CO
2
span sample flow varies excessively as the ambient temperature
changes, or if the pressure rise at shut-off is excessive, consider using a
different regulator.
The amount of zero or CO
2
span gas consumed depends on the details of the
application. The following example shows how to estimate the expected
consumption.
52