Cooling analysis – Chatsworth Products CPI Power Management Tool User Manual
Page 46
Power Management Tool Manual
March 2014
Chatsworth Products, Inc.
(CPI)
46
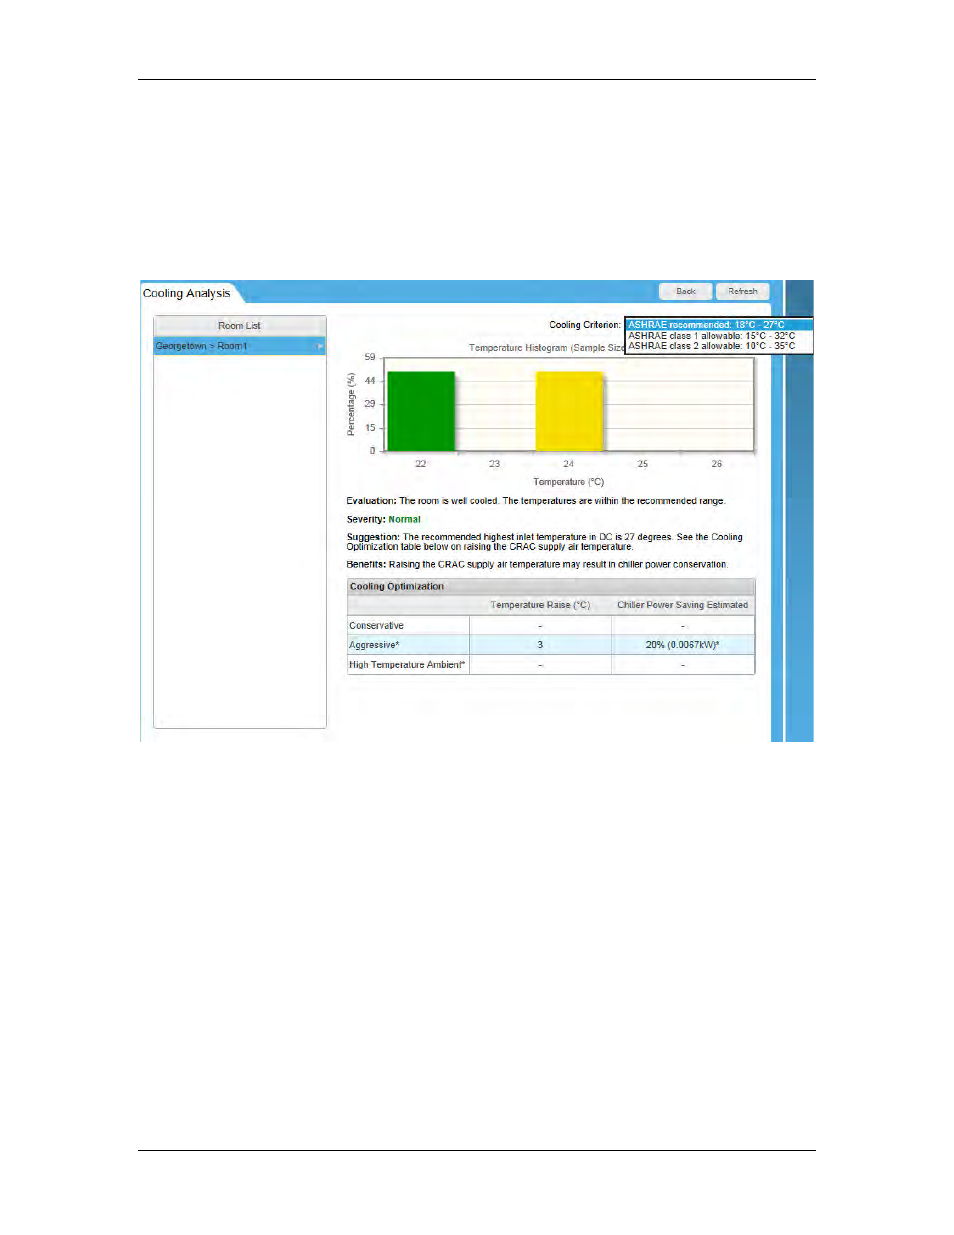
Cooling Analysis
On the Cooling Analysis page, the Temperature Histogram figure for the room
selected provides real-time monitoring data of the inlet temperatures.
The X-axis shows the temperature values and the Y-axis gives the percentages of
servers with the corresponding temperature values. Sample Size shows the number of
the devices whose temperature can be monitored in the selected room.
The current cooling status is evaluated with suggestions given, along with possible
actions and the Benefits of taking these actions.
For example, when servers with inlet temperatures higher than the limit in Settings (27
degrees Celsius as default) are detected, they will be displayed in the Hotspots list.
If you need to refresh the temperature data, click Refresh on the top right.